Stocks Candlestick Patterns Explained With Examples PDF
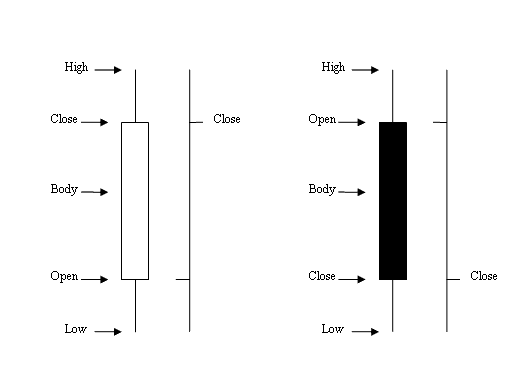
Stocks Candlesticks - these candlesticks use the same price data as bar charts (open, high, low, and close). However, these candlesticks resembles a candle with wicks on both ends as opposed to bar charts that resembles bars.
How to Analyze Candlesticks Patterns
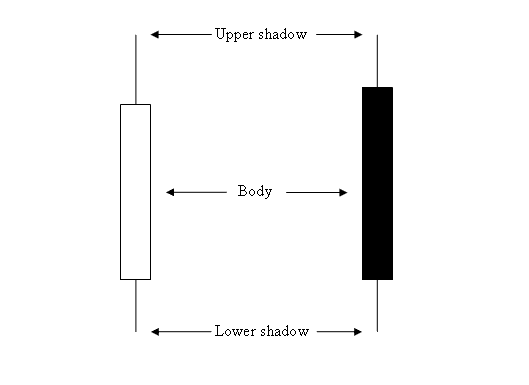
The rectangle part of a stocks trading candle-stick is called the body.
The high and low of candle stick are described as shadows and plotted as poking lines.
How to Interpret Candlesticks Patterns
The color of the candlestick is either blue or red
- (Blue or Green Color) - Stocks Prices moved up
- (Red Color) - Stocks Prices moved down
Most stocks trading softwares like the MT4 stocks platform, use colors to mark the direction. Colors used are blue or green - green color candlesticks: when price moves up, red color candlesticks: when price moves down.
Candles Charts Vs. Bars Charts
Stock Candle Patterns Explained With Example PDF
Doji Candle Patterns Explained With Example PDF
This is a stocks candle pattern with same opening & closing stocks price. There are various types of doji candles pattern that form on Stocks charts.
following examples illustrate various patterns of the doji candle-stick:
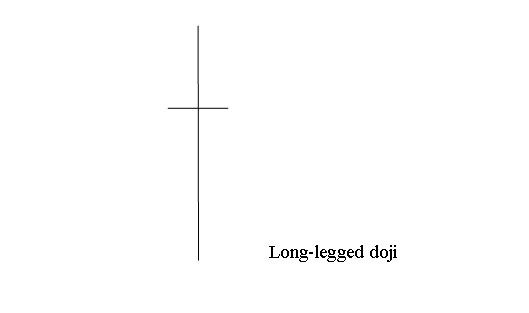
Long-legged doji candle pattern has long upper & lower shadows with opening & closing stocks price at the middle. When the Long legged doji pops up on a Stocks chart it indicates indecision between stock traders, the buyers & the sellers.
Shown Below is example screenshot image of the Long Legged Doji stock candlesticks pattern
Doji Stock Pattern - Doji Candle Patterns Explained With Example PDF
Doji Stock Pattern - Doji Candle Patterns Explained With Example PDF
Marubozu Candle Patterns Explained With Example PDF
Marubozu stocks candlestick pattern are long candles that have no upper or lower shadows, Like ones displayed below.
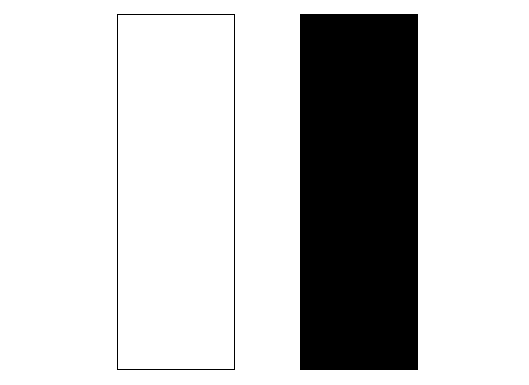
Marubozu Candles - Marubozu Candle Patterns Explained With Example PDF
Marubozu stocks candle pattern are continuing stocks candlestick patterns which show stocks price is going to continue in the same direction as that of the marubozu candlestick. The marubozu candles pattern can be white/blue or black/red depending on direction of the trend.
Spinning Tops Candles Stock Candle Patterns Explained With Example PDF
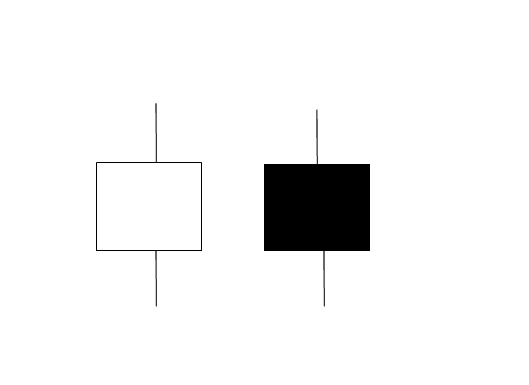
Spinning tops stocks candlestick pattern have a small body with long upper and lower shadows. These spinning top candlesticks patterns are referred to by this name because these candlesticks arrangements are similar to spinning top on a match-stick.
The upper and lower shadows of the spinning tops stocks candles pattern are longer than the body. Example illustrated & described below shows the spinning top candle pattern. You can look for pattern on your MT4 Stocks Platform stocks charts. Example illustrated & described below shows a screen-shot to help traders when it comes to learning & understanding these stocks candle pattern.
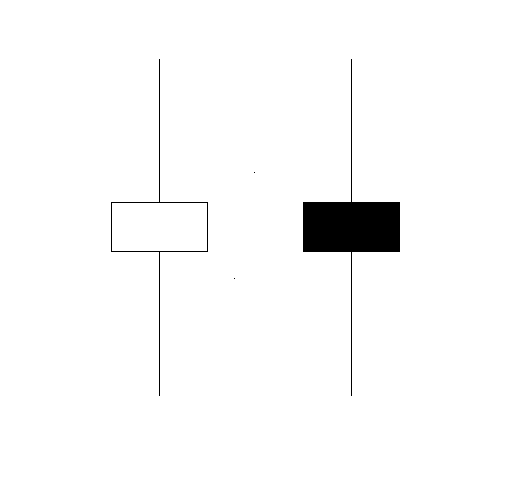
How to Read Stocks Candlestick Charts - Spinning Tops Candle Patterns Explained With Example PDF
Color of the spinning top candlestick stocks candle-sticks pattern is not very important, this formation show the indecision between the buyers & sellers in the Stocks market. When these stocks patterns appear at the top of a stocks trend or at the bottom of the stocks trend it might signify that the stocks trend is coming to an end & it may soon reverse and start going the other direction. However, it is best to wait for confirmation signals that the direction of a stocks has reversed before trading the signal from this stocks candlestick pattern formation.
Hammer Candle Pattern & Hanging Man Candle Pattern Stock Candle Patterns Explained With Example PDF
Hammer Candlestick Pattern and Hanging Man Candlestick Pattern candles look alike but hammer is bullish reversal stocks candlestick pattern and hanging man is a bearish reversal stocks candle pattern.
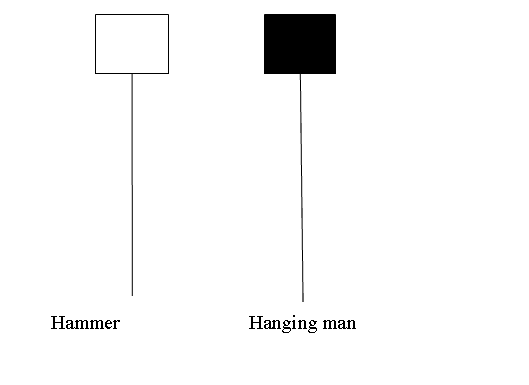
Hammer Candlestick Pattern and Hanging Man Candlestick Pattern - Stock Candle Patterns Explained With Example PDF
Hammer Candle Stock Candle Patterns Explained With Example PDF
Hammer stocks candle pattern is a potentially bullish stocks candlestick pattern which forms during a stocks downwards trend. It is named so because the stocks market is hammering out a market bottoms.
Hanging Man Candle Stock Candle Patterns Explained With Example PDF
This hanging man candle pattern is a potentially bearish stocks reversal signal which occurs during a stocks upwards trend. It is named so because it resembles a man hanging on a noose up high.
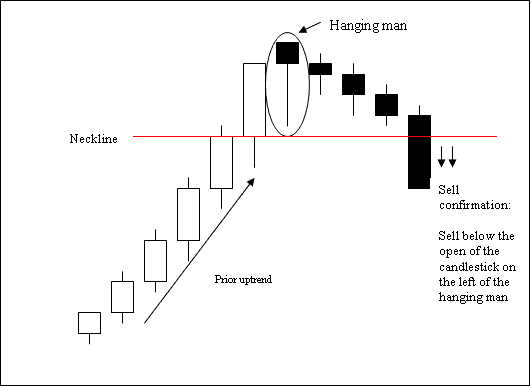
Hanging Man Candlestick Pattern
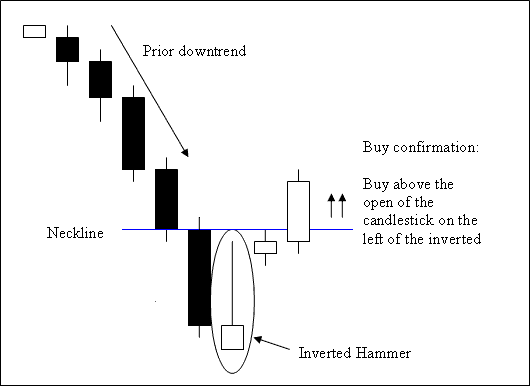
Inverted Hammer Candle Stock Candle Patterns Explained With Example PDF
This is a bullish reversal candlestick pattern. It forms at the bottoms of a Stocks trend.
Inverted hammer candle pattern forms at the bottom of a down stocks trend & indicates the possibility of reversal of the downward Stocks trend.
Inverted Hammer Candle Pattern - Stock Candle Patterns Explained With Example PDF
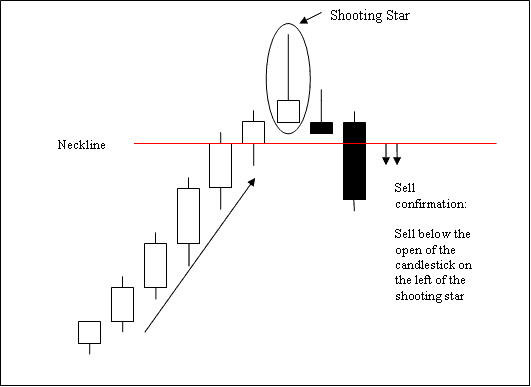
Shooting Star Candlestick Stock Candle Patterns Explained With Example PDF
Shooting Star is a bearish reversal candlestick pattern. It occurs at the tops of a stock trend.
Shooting Star stocks candlestick pattern occur at the top of an up stocks trend in the Stocks market where the open stocks price is the same as the low & stocks price then rallied up but was pushed back down to close near the open.
Shooting Star Candlestick - Stock Candle Patterns Explained With Example PDF
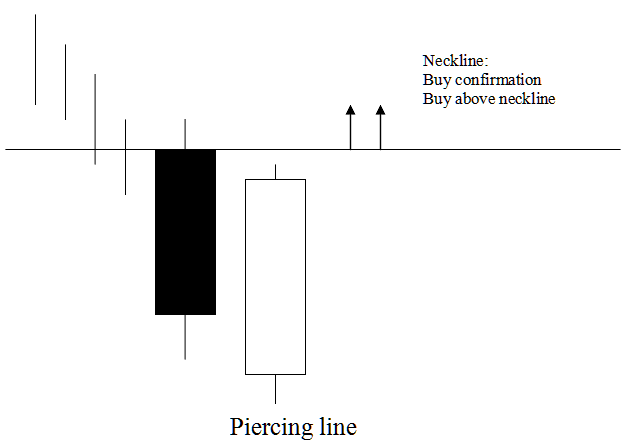
Piercing Line Candle Stock Candle Patterns Explained With Example PDF
Piercing line candle stick pattern is a long black body followed by a long white body candle-stick.
The white body pierces the mid point of the prior black body.
This Piercing Line stocks candlestick pattern is a bullish reversal candle pattern that forms at the bottom of a market downwards stock trend. It shows that the stocks market opens lower and closes above the midpoint of the black body.
This Piercing Line stocks candlestick pattern shows that the momentum of the down stocks trend is reducing and stocks market stocks trend is likely to reverse and move in an upward direction.
This Piercing Line stocks candlestick pattern is shown known as a piercing line signifying the stocks market is piercing the bottom showing a market floor for the stock price downwards trend.
Piercing Line Stock Candle Pattern - Stock Candle Patterns Explained With Example PDF
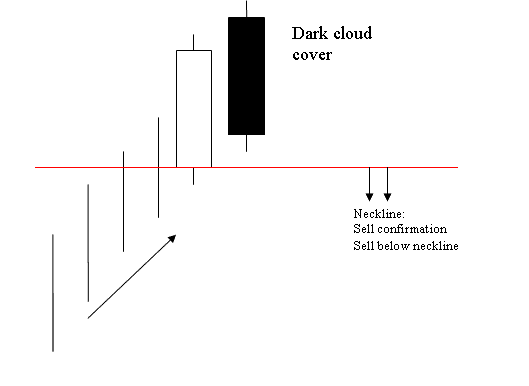
Dark Cloud Cover Candlestick Stock Candle Patterns Explained With Example PDF
Opposite of piercing candle-stick stocks candle.
This candlestick is a long white body followed by a long black body.
The black body pierces the midpoint of the prior white body.
This is a bearish reversal stocks pattern which forms at the top of an upwards stock trend.
Dark Cloud cover stocks candle pattern that the stocks market opens higher and closes below the midpoint of the white body.
Dark Cloud cover stocks candlestick pattern shows that the momentum of the up stocks trend is reducing and stocks market stocks trend is likely to reverse and move in a downward stocks direction.
Dark Cloud cover stocks candlestick pattern is shown known as a cloud cover signifying the cloud as a ceiling for stock price upwards trend.
Dark Cloud Cover Candlestick Pattern
Morning Star Candle Stock Candle Patterns Explained With Example PDF
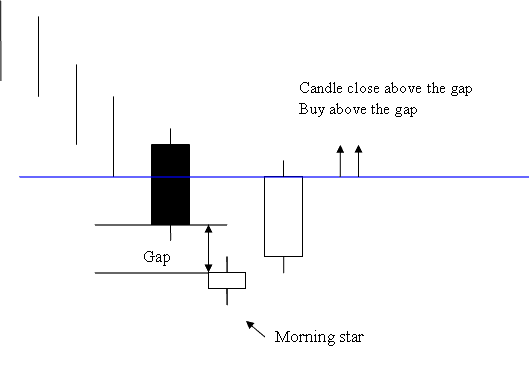
Morning Star Candle Pattern - Stock Candle Patterns Explained With Example PDF
Evening Star Candlestick Stock Candle Patterns Explained With Example PDF
Opposite of the morning star candlesticks pattern
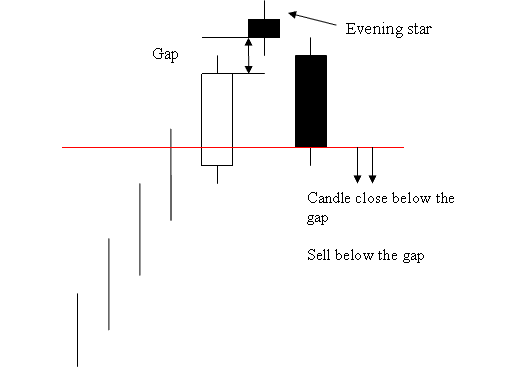
Evening Star Candlestick Pattern - Stock Candle Patterns Explained With Examples PDF - Candlestick Guide
Engulfing Candlesticks Patterns
Engulfing is a reversal candlestick pattern which can be bearish or bullish depending upon whether it appears at the end of a stocks market down stocks trend or at the end of a stocks market upward trend.
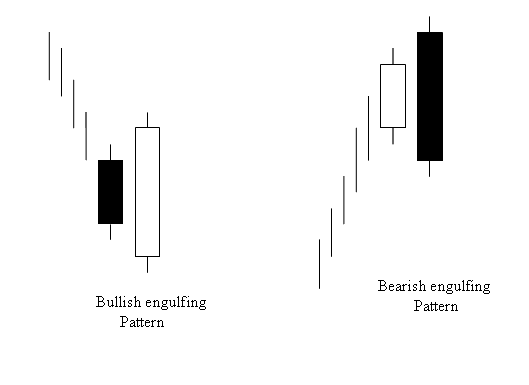
Bullish & Bearish Engulfing Candles Patterns - Stock Candle Patterns Explained With Example PDF
Stock Candle Patterns Explained - Stock Candle Patterns Tutorial PDF


