Morning Star Candlesticks, Evening Star Candles and Engulfing Candle-sticks Pattern Setups
Bullish Engulfing Candle-stick Pattern and Bearish Engulfing Candle-stick Pattern
Morning Star Candlestick Pattern

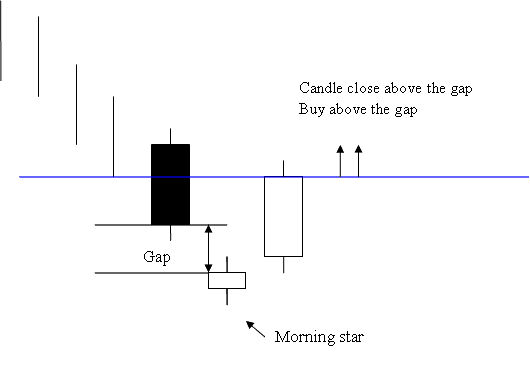
Morning Star Candle Pattern
Morning Star Candle Pattern
Morning star candle-stick pattern is a three day bullish reversal pattern.
First day is a long black candle.
Second day is a morning star that gaps away from the long black candle-stick.
Third day is a long white candlestick which fills the gap.
Filling of the gap & closing of the white candle above the trading gap is a strong bullish signal.
Traders should open a buy trade after market price closes above the gap formation of the morning star candle pattern. This is the confirmation signal of a buy signal generated by this Morning Star Candlestick pattern.
Evening Star Candlestick Pattern
Opposite of the morning star

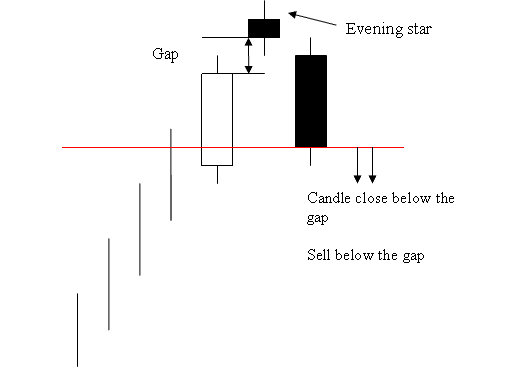
Evening Star Candlestick Pattern
Evening Star Candlestick Pattern
Evening star candle-stick pattern is a three day bearish reversal pattern.
First day is a long white candlestick.
The second day is the evening star which gaps away from long white candle.
Third day is a long black candle which fills the gap.
Filling of the gap & closing of the black candle below the gap is a strong bearish signal.
Traders should open a sell trade once the market closes below the gap formation of evening star candlestick pattern. This is the confirmation signal of a sell signal generated by this Evening star candle pattern setup.
Engulfing Pattern
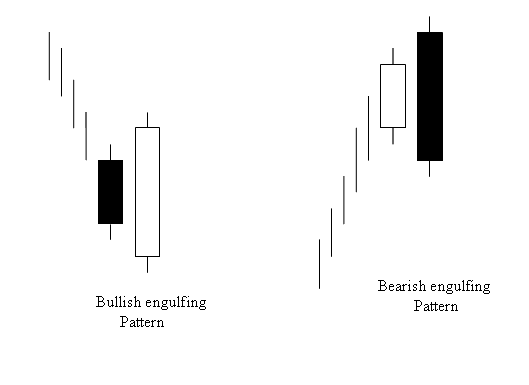
Engulfing is a reversal candlestick pattern which can be bearish or bullish depending upon whether it appears at the end of a market down trend or at the end of a market up-ward trend.

Bullish & Bearish Engulfing Pattern
Bullish & Bearish Engulfing Candle-stick Patterns
Color of the first candle indicates the trend of the day.
The second candle-stick should completely engulf the first candle & the candle-stick should have the opposite color.
For Bullish Engulfing the color of the candlestick should be Blue
For Bearish Engulfing the color of the candle should be Red


