MACD Stock Indices Indicator Crossover Stock Indices Signals
MACD Center line crossovers generate stock index trading signals using the center line mark. The sentiment of the stock index trading market can be confirmed using the MACD center line crossovers. MACD stock indices crossover above the center line mark generates bullish stock index trading market sentiment while crossover below the center line generates bearish stock indices market sentiment.
- When the FastLine crosses below the MACD Line (not center mark) it shows stock indices market momentum is slowing - this is not a reversal stock indices signal or a sell signal, wait for the center-mark crossover.
- When the Fast line crosses above the MACD Line (not center mark) it shows the stock indices market momentum is slowing - this is not a reversal stock indices signal or a buy signal, wait for the center-mark crossover.
- The Center-Line crossover stock indices signals will be the best trading signals for validating buy and sell signals.
Using the Stock Indices Trading chart in the stock indices example illustrated below, when MACD fast line crossed below the zero center mark, the sell signal was confirmed and the stock indices market sentiment changed to bearish - downwards stock index trend.
Also in the stock indices example illustrated below when MACD fast line later crosses above zero center mark, a buy signal was generated and the stock indices market sentiment changed to bullish - upwards stock index trend.
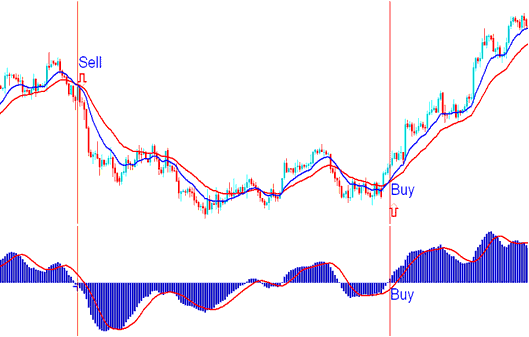
MACD Zero-Line Mark Crossover - Precisely When a Sell Stock Indices Signal and Buy Stock Indices Signal are Generated
Oscillation of the MACD Indicator
The MACD Indices indicator is an oscillator indicator that moves up and down around a zero center line mark. The center-line is the neutral measurement, values above zero will indicate bullish stock index trading market stock indices trend while values below indicate bearish stock index trend.
The MACD indicator is also used to indicate overbought and oversold levels. When the MACD reaches overextended levels, then a stock indices instrument is overbought or oversold. However, in a strong upward trending stock indices market stock index prices will stay overbought in this case it's better to buy.
Also in a strong down stock index trending stock index trading market its better to sell, because stock index prices will stay in the oversold region for a long time.
Over-bought conditions occur above the zero line while over-sold conditions occur way below the zero mark.
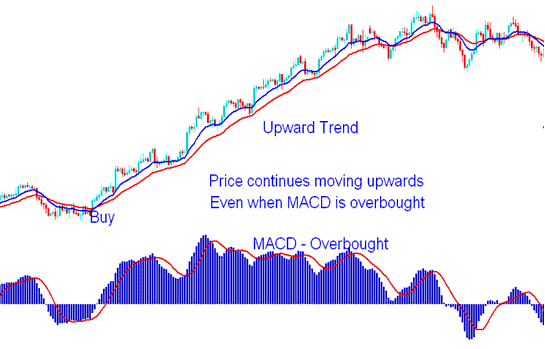
MACD Overbought Region - Stock Indices Trend Continuation Signal


