Classic Bullish Stock Indices Trading Divergence vs Classic Bearish Indices Trading Divergence
In stock index trading, classic divergence is used as a possible sign for a stock indices trend reversal and is used by traders when looking for an area where stock index price could reverse and start going in the opposite direction. For this reason this stock indices setup is used as a low risk entry method and also as an accurate way of exit out of a stock index trade.
This strategy is a low risk technique to sell near the top or buy near the bottom, this makes the risk on your trades are very small relative to the potential reward. However, this is one technique with very many whipsaws and most traders do not recommend using it.
Divergence in Trading is also used to predict the optimum point at which to exit a trade. If you already have an open trade that's already profitable, a good way to spot a profit taking level would be the point where you spot this stock index trading setup.
There are two types, based on the direction of the Stock Indices trend:
- Classic Bullish divergence
- Classic Bearish divergence
Stock Indices Classic Bullish Divergence
Classic bullish divergence set-up occurs when price is making lower lows ( LL ), but the oscillator is making higher lows (HL). The example illustrated below shows a picture of this stock index trading setup.
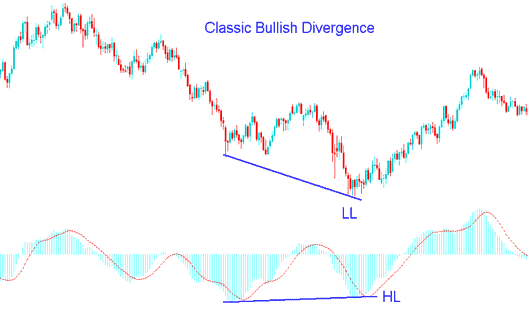
Indices Classic Bullish Divergence
This examples uses MACD indicator as a Stock Indices Trading divergence indicator.
From the above example the stock index price made a lower low(LL) but the indicator made a higher low(HL), this shows there is a divergence between the stock index price and indicator. This signal warns of a possible stock indices trend reversal.
Classic bullish diverging signal warns of a possible change in stock indices trend from down to up. This is because even though the stock index price went lower the volume of sellers who pushed the stock index price lower was less as illustrated by the MACD technical indicator. This indicates underlying weakness of the downwards stock index trend.
Classic bearish Stock Indices Trading Divergence Setup
Classic bearish divergence setup occurs when price is making a higher high ( HH ), but the oscillator is lower high (LH). The image below shows an example of the setup.
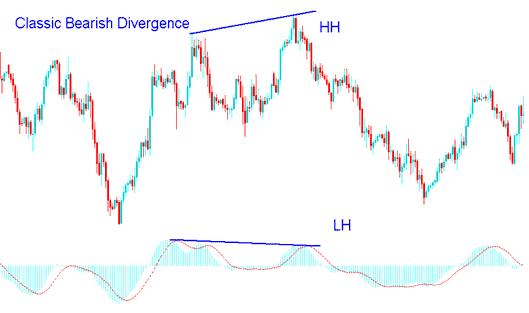
Stock Indices Classic Bearish Divergence
This examples also uses MACD indicator
From the above example the stock index price made a higher high(HH) but the indicator made a Lower High(LH), this shows there is a divergence between the stock index price and indicator. This signal warns of a possible stock indices trend reversal.
Classic bearish diverging signal warns of a possible change in the stock indices trend from up to down. This is because even though the stock index price went higher the volume of buyers that pushed the stock index price higher was less as illustrated by the MACD indicator. This indicates underlying weakness of the upwards trend.
In the example above, if you as a trader had used divergence setup to trade you would have gotten good signals to enter or exit the trades at an optimal point. However, divergence trading signals just like other indicators, is also prone to whipsaws. That is why it's always good to confirm the diverging signals with other technical indicators such as the RSI, Moving Averages & Stochastic Oscillator.
A good indicator to combine classic diverging setups is the stochastic oscillator and wait for the stochastic lines to move in direction of the divergence signal so as to confirm the trading signal.
Another good technical indicator to combine with is the moving average technical indicator, in this indicator a trader should use the Moving Average Crossover System
Examples of Moving Average Crossover Method Strategy
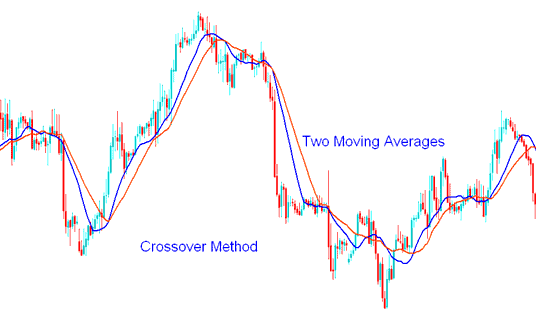
Once the divergence signal is given, a trader will then wait for the Moving average cross-over system to give a signal in the same direction, if there is a classic bullish setup, a trader will wait for the moving average system to give an upward crossover signal, while for a bearish classic divergence signal the trader should wait for the Moving average cross-over system to give a downward bearish crossover trading signal.
By combining the classic divergence trading signals with other indicators this way, a trader will be able to avoid whip-saws when it comes to trading the classic diverging signals, because the trader will wait until the stock indices market has actually reversed and is already moving towards this direction, hence the trader will not fall into the trap of picking market tops and bottoms.


