How Do You Analyze Coppock Curve Indicator Buy Signal and Sell Signal?
Coppock Curve How to Analyze Indicator Buy Signal
How Do I Analyze Forex Buy Signal Using Coppock Curve Indicator?
Steps on how to interpret forex buy signals using Coppock Curve technical forex indicator:
This Coppock Curve technical forex indicator buy signal guide explains and gives details on how to interpret forex buy signals using the Coppock Curve technical forex indicator as shown below:
How Do I Analyze Forex Buy Signals Using Coppock Curve Indicator
Coppock Curve How to Analyze Indicator Sell Signal
How Do I Analyze Forex Sell Signal Using Coppock Curve Indicator?
Steps on how to interpret forex sell signals using Coppock Curve technical forex indicator:
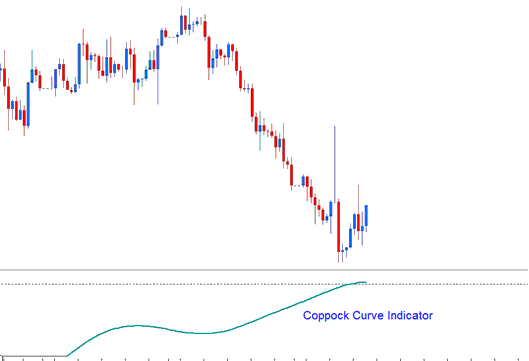
This Coppock Curve technical forex indicator sell signal guide explains and gives details on how to interpret forex sell signals using the Coppock Curve technical forex indicator as shown below:
How Do I Analyze Forex Sell Signals Using Coppock Curve Indicator
Coppock Curve technical forex indicator was used for technical analysis in forex trading.
Coppock Curve technical forex indicator - The principle behind this Coppock Curve technical forex indicator is the psychology of forex trading, based on the theory that human habits are predictable. And forex price movement always oscillates in a zigzag manner.
The principle of adaptation-level applies to how forex price reacts at certain levels - forex prices will react in the same way or same pattern as those observed historically.
How Do I Analyze Coppock Curve Buy & Sell Forex Technical Analysis Signals?
In Forex trading, The moving average is the simplest form of an adaptation-level - the forex price will oscillate around the moving average. This forms the basis of this Coppock Curve technical forex indicator, which is a longer term oscillator based on this adaptation-levels - moving average, but in a different way.
Oscillators usually begin by calculating a percent % change of the current forex price from some previous forex price level, where the previous forex price level is the reference point - adaptation-level.
Edwin Coppock reasoned that the forex market participants' emotional state could be quantified by summing up the percent % changes in forex price over the recent past to get a general sense of the forex market's longer term momentum.
For example, If we compare forex prices relative to a week ago and we see that this day the market is up 20% compared to a week ago, the previous day it was up 15% over the previous day, and 10%, 7.5% and 5% respectively the days before that, then we may determine that the forex market is gaining momentum.
Basic forex trading signals can also be generated using the Coppock Curve technical forex indicator to trade forex price reversals from extreme forex price levels. Forex trend-line break signals may also be combined with Coppock Curve technical forex indicator to confirm the forex trading signals generated by this forex trading indicator.
How Do I Analyze Coppock Curve Technical Indicator?


