How Do I Analyze TSI?
TSI
How Do I Analyze Buy Forex Signal Using TSI Indicator?
Steps on how to analyze forex buy signals using TSI - True Strength Index indicator:
This TSI - True Strength Index indicator buy signal lesson gives an explanation of how to analyze forex buy signals using the TSI - True Strength Index indicator as shown on example below:
Forex trades can be generated when the TSI - True Strength Index indicator crosses these levels.
Buy Forex Signal - when the TSI - True Strength Index indicator levels cross above -25 level a buy signal is generated.
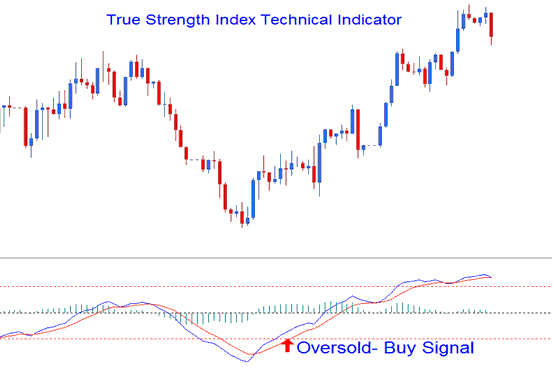
Oversold? - Buy Forex Signal
How Do I Interpret Buy Forex Signals Using TSI Indicator
TSI
How Do I Analyze Sell Forex Signal Using TSI Indicator?
Steps on how to analyze forex sell signals using TSI - True Strength Index indicator:
This TSI - True Strength Index indicator sell signal lesson gives an explanation of how to analyze forex sell signals using the TSI - True Strength Index indicator as shown on example below:
Forex trades can be generated when the TSI - True Strength Index indicator crosses these levels.
Sell Forex Signal - when the TSI - True Strength Index indicator levels cross below +25 level a sell signal is generated.
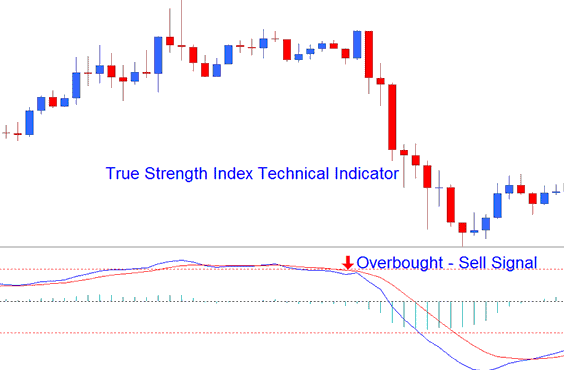
Overbought? - Sell Forex Signal
How Do I Interpret Sell Forex Signals Using TSI Indicator
How Do I Interpret TSI Indicator? - How Do I Analyze TSI? - True Strength Index Indicator Buy & Sell Forex Signal?


