How Do I Analyze Bollinger Bands Indicator Buy Forex Signal & Sell Signal?
Bollinger Bands How to Analyze Indicator Buy Signal
How Do I Analyze Bollinger Bands Indicator Buy Forex Signal?
Steps on how to analyze forex buy signals using Bollinger Bands indicator:
This Bollinger Bands indicator buy signal lesson gives an explanation of how to analyze forex buy signals using the Bollinger Bands indicator as shown on example below:
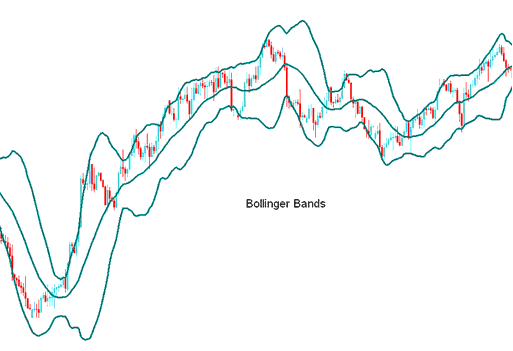
How Do You Interpret Bollinger Bands Indicator?
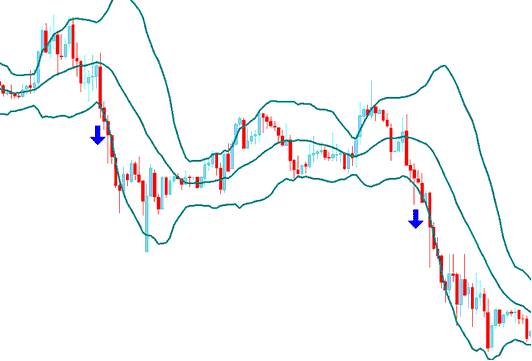
Bollinger Bands How to Analyze Indicator Sell Signal
How Do I Analyze Bollinger Bands Indicator Sell Forex Signal?
Steps on how to analyze forex sell signals using Bollinger Bands indicator:
This Bollinger Bands indicator sell signal lesson gives an explanation of how to analyze forex sell signals using the Bollinger Bands indicator as shown on example below:
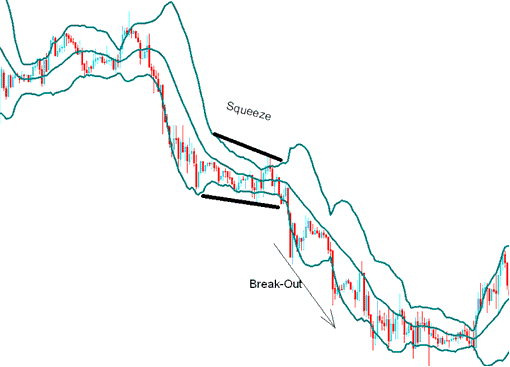
the Bollinger Band Squeeze
The Bollinger bands tighten as volatility lessens, this identifies periods of forex price consolidation. Steep forex price break-outs tend to occur after the Bollinger bands tighten.
How Do You Interpret Sell Forex Signals Using Bollinger Bands Technical Indicator
the Bollinger Bands Bulge
If forex prices break through the upper or lower band and move outside the bands a continuation of the current forex trend is expected.
How Do You Interpret Bollinger Bands Indicator?
Double Tops and Double Bottoms Trading Patterns
Double Bottoms and Double Tops made outside the bands followed by bottoms and tops made inside the bands signal for reversals in the forex trend
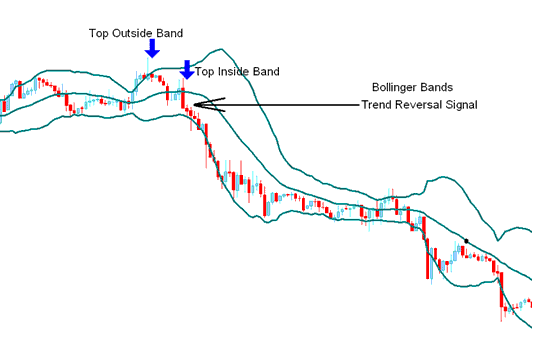
How Do You Interpret Bollinger Bands Indicator Sell Forex Signal?
How Do You Interpret Bollinger Bands Indicator?


