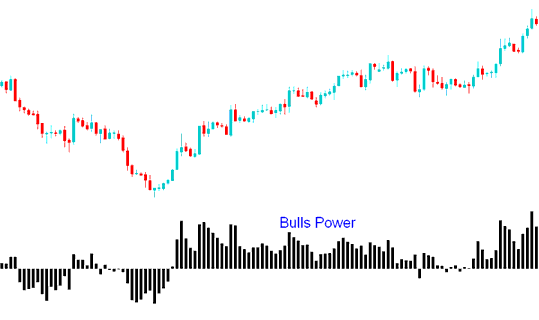
Bulls Power Analysis and Bulls Power Signals
Created and Developed by Alexander Elder
Bulls Power evaluates buyer strength by measuring the balance of power between bulls (buyers) and bears (sellers).
This indicator tries to figure out if a bullish trend will continue or if the trading price is at a point where it might change direction.
Calculation
A Price bar has 4 parameters: the Opening, Closing, High and Low of price candlestick.
Each price bar concludes its formation either above or below the closing price of the bar immediately preceding it.
The High Price Shows the Peak Strength of Bulls in a Trading Session.
The low price shows sellers' top strength in that trading time.
This Indicator uses the High of the price & a MA (Exponential Moving Average)
The moving average (MA) represents the equilibrium point between buyers and sellers during a specific price period.
Hence:
Bulls Power = High Price - EMA

Bulls Power
Technical Analysis and How to Generate Signals
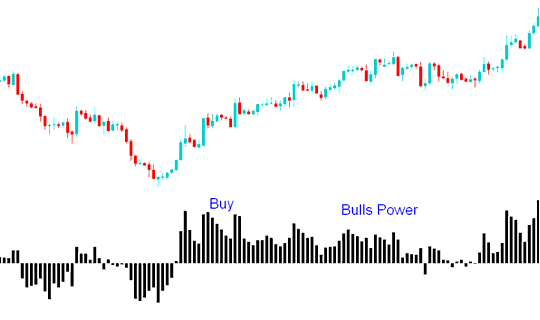
Buy Signal
A buy trade signal gets derived & generated when Bulls Power oscillator technical indicator goes above Zero.
In an uptrend, the high beats the EMA. Bulls Power stays above zero. The histogram sits over the zero line.

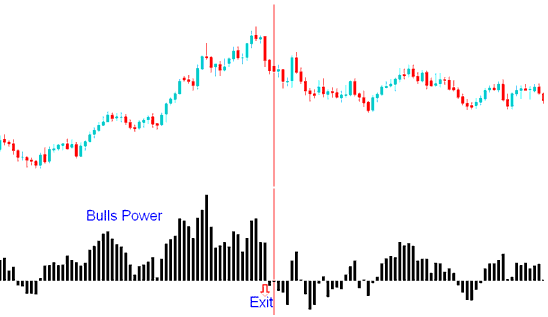
Exit Signal
If the HIGH is less than the Exponential MA(Moving Average), it signals that prices are decreasing, while the Bulls Power histogram goes below the zero line.

The Triple Screen approach uses this indicator to spot trends on a big time frame, like daily. Then apply Bulls Power on a smaller one, such as hourly. Trade signals only match the main trend from the larger chart.
Get More Lessons:
- Using the Aroon Oscillator to Buy or Sell in Forex
- What XAUUSD Amount is Best with $100 in XAUUSD Trade?
- Selecting the Best Online Broker for DAX30 Index Trading
- Illustrating Gold (XAUUSD) Margin Levels
- Training resources and tutorials for NETH 25 trade optimization.
- How to Trade Using FX Managed Accounts
- Automated System for McClellan Oscillator Trade
- Where Can I Locate Nasdaq on the MetaTrader 5 Software?
- USDZAR System for USDZAR Trading Strategy

