Pivot Points XAUUSD Technical Analysis & Pivot Points XAUUSD Signals
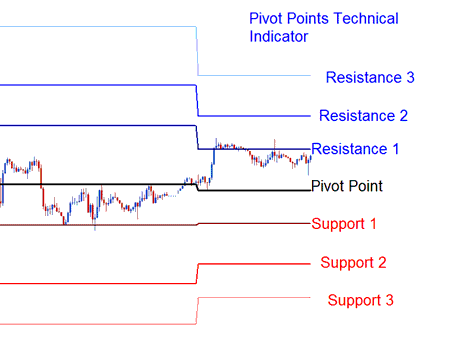
Pivot Points XAUUSD Indicator consists of a central xauusd pivot which is surrounded by 3 resistance levels above & Three support levels below the center pivot-point.
Pivot Points Gold Technical Indicator is considered to be leading technical indicator.
Pivot Points XAUUSD Indicator provides a quick method for traders to analyze the general xauusd trend and analyze how the xauusd market is going to be moving during the day. A few calculations are used to plot the resistance & support levels for pivot point indicator.
To calculate these support & resistance areas for the coming trading day - the previous day's
- high,
- low, and
- closing gold prices are used
The xauusd trading day closes at its specified time and this daily closing time is when the Pivot Points Gold Indicator is updated.
24-hour cycle for this Pivot Points XAUUSD Indicator are calculated using a complex formula - the central xauusd pivot is then used to calculate the support and resistance areas as follows:
Resistance Level 3
Resistance Level 2
Resistance Level 1
XAUUSD Pivot Point Technical Analysis
Support Level 1
Support Level 2
Support Level 3
Technical Analysis in XAUUSD Trading
Pivot Points XAUUSD Indicator can be used in different techniques to generate trading signals. Following strategies are the most oftenly used technical analysis strategies:
Pivot Points XAUUSD Technical Indicator Trend Identification
The central xauusd pivot point is used by traders to determine the xauusd trend direction. The gold trades opened by traders will only be in the direction of this xauusd trend.
- Buy xauusd signal - bullish xauusd trend -price is above the central xauusd pivot point
- Sell xauusd signal - bearish xauusd trend -price is below the central xauusd pivot point
Pivot Points Indicator XAUUSD Price Break-out Signals
XAUUSD price break-out signals are generated as follows
- Buy xauusd signal is generated when the price breaks upwards through the central xauusd pivot point.
- Sell xauusd signal is generated when the price breaks-out downward through the central xauusd pivot point.
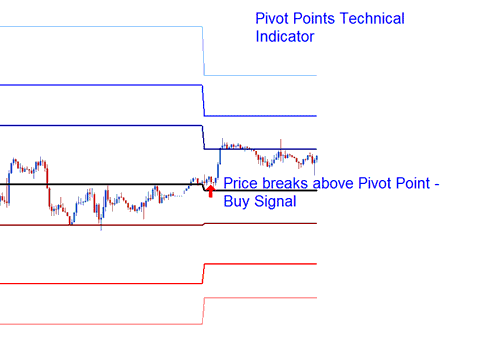
Pivot Points Indicator XAUUSD Price Break out
Pivot Points Indicator XAUUSD Price Reversal XAUUSD Signal
Pivot Points Indicator XAUUSD Price reversal gold signals are generated as is explained below
Buy xauusd signal - when price moves downward toward one of the pivot-points indicator support level, then touches support zones or moves slightly through this support area then quickly reverses and moves upwards.
Sell xauusd trading signal - when price moving up towards one of the pivot point resistance area, then touches resistance level or moves slightly through this resistance area then quickly reverses and moves downwards.
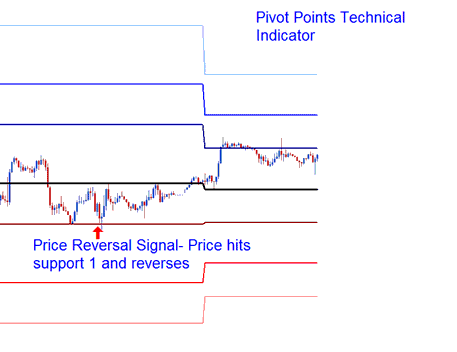
Pivot Points Indicator XAUUSD Price Reversal XAUUSD Signal
Setting Stoploss and Take Profit XAUUSD Order Levels
The central xauusd pivot point and the other support levels & resistance levels of this pivot points indicator are used by traders to determine suitable xauusd stop loss setting levels & xauusd take profit areas.
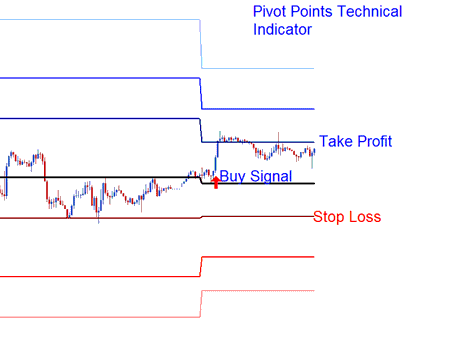
Setting Stop Loss XAUUSD Order Levels & Setting Take Profit XAUUSD Order Levels
If a buy order is placed above the central xauusd pivot point the Resistance Level 1 or Resistance Level 2 can be used to set the take profit level, and the Support Level 1 can be used to set the Stop Loss XAUUSD Order Level for the gold trade transaction.
To download XAUUSD Trading Pivot Points MT4 Indicator: https://c.mql5.com/21/9/pro4x_pivot_lines.mq4 Once you download the Pivot Points Gold Indicator - open the indicator with MQL4 Language Editor, Then Compile Pivot Points MT4 Indicator by pressing the Compile Button and Pivot Points MT4 Indicator will be added to your MT4 platform. NB: Once you add Pivot Points MT4 Indicator to your MT4, the indicator has additional lines named Mid Points, to remove these additional Pivot Points MT4 Indicator lines open MQL4 Language Editor(shortcut keyboard key - press F4), and change line 16 from: extern bool midpivots = true: to extern bool midpivots = false: Then Press Compile again, and Pivot Points MT4 Indicator will then appear as exactly shown on this learn xauusd website.


