Momentum XAUUSD Technical Analysis & Momentum Trading Signals
The Moving Average Envelopes indicator creates two lines around the gold trading price forming a channel. The upper and lower channel lines are drawn at an equidistant level above and below the MA. The distance to draw the envelopes is calculated using a percent or a number of pips.
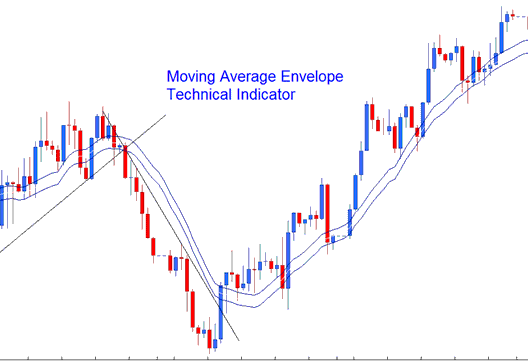
Moving Average Envelope
Gold Technical Analysis & Generating XAUUSD Signals
MA Envelope can be traded using several different rules. Main method of generating xauusd trading signals is to use the gold price penetrating the upper channel or lower channel.
Bullish Trading Signal
XAUUSD Price penetrating the upper channel is a long buy gold trade signal.
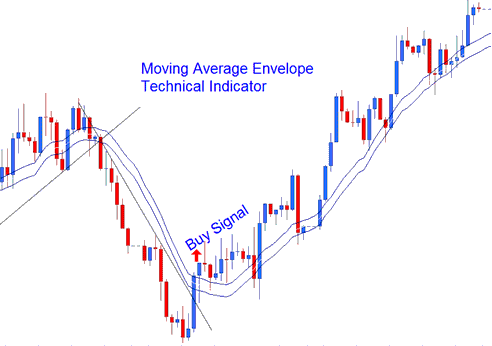
Buy XAUUSD Signal
Bearish Trading Signal
XAUUSD Price penetrating the lower channel is a short sell gold trade signal.
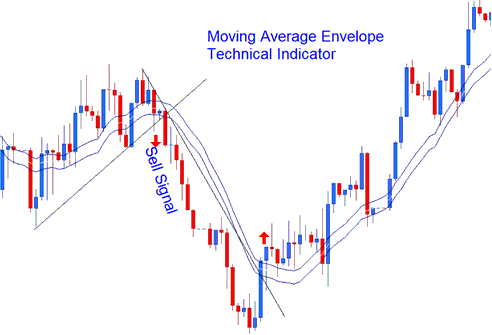
Sell XAUUSD Signal
In a trending market the Moving Average points upward in an up xauusd trend market or downward in a down xauusd trending market. It is good to use the envelopes together with other indicators such as xauusd trendlines so as to confirm the signals generated.
