Kase Peak Oscillator and Kase DevStop 2 XAUUSD Technical Analysis & XAUUSD Signals
Created by Cynthia Kase
The Kase Peak Oscillator technical indicator is used in same way as other traditional oscillators, but the oscillator is derived from a statistical evaluation of the XAUUSD trend: this statistical evaluation evaluates over 50 different xauusd trend lengths. The oscillator is capable of automatically adapting itself to the cycle length & volatility changes of the trend.
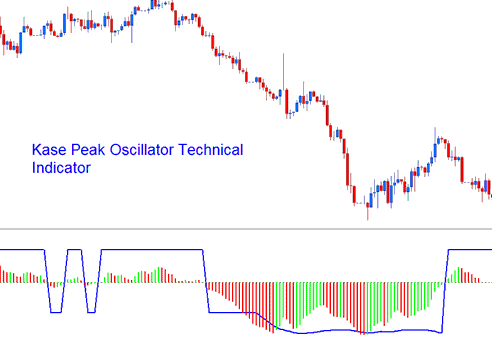
Kase Peak Oscillator Technical Indicator
Histogram values below the center line signify bearish trends while values above the center line signify bullish values. Crossover signals are used as both entry and exit points.
Kase DevStop II Indicator
Created by Cynthia Kase
The Kase DevStop II calculates an average range, & the 3 standard deviations of this range.
XAUUSD Analysis of Kase DevStop II
This Indicator is used to determine the realistic exit points for trades based on volatility, variance of the volatility and the volatility skew. This xauusd indicator plots 4 lines. 4 lines are described as a Warning Line & 3 Standard Deviation Lines of 1, 2 and 3. These lines allow XAUUSD traders to take profit or cut trading losses at the levels where the probability of a trade remaining profitable is very low, at the same time without taking more of a loss or cutting profit any time sooner than it's necessary.
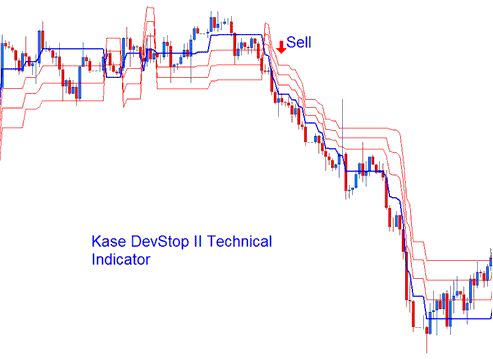
Kase DevStop 2
The three red lines are used by traders to set exit levels or stop loss levels. The DevStop II is a xauusd trend following indicator.


