Continuation Chart Patterns
When these particular continuation formations materialize, they serve to confirm that the current prevailing trend is set to persist in its existing trajectory.
These patterns are employed by traders to identify halfway points in the trend, as they typically form at the midpoint of a market trend.
There are 4 types:
- Ascending triangle
- Descending triangle
- Bull flag/pennant
- Bear flag/pennant
Ascending Triangle
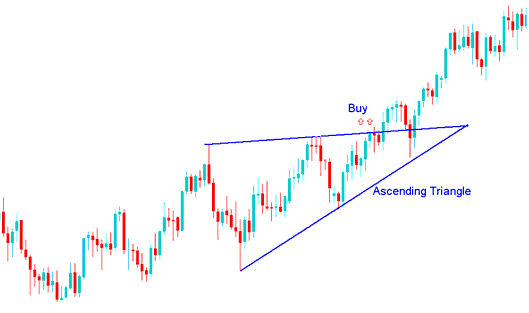
The ascending triangle is formed in an up trend & it shows that upward direction of the market price is going to continue.
This shows a resistance zone where buyers keep pushing the price higher. Once the gold price breaks through, it usually keeps moving up.
The resistance zone overhead temporarily impedes further upward market movement, while the ascending trendline situated beneath the structure confirms the ongoing presence of buying interest (bulls). A decisive upward breach beyond this upper line serves as a confirmed buy signal for a market exiting an ascending triangle pattern.
In an uptrend, the ascending triangle builds as a pause in the rise. It signals the upward move will keep going.

During its uptrend, the market established an ascending triangle, leading to a continuation pattern upward. The definitive buy signal occurs when the price decisively breaks above the upper sloping boundary, with the market continuing its ascent.
Descending Triangle
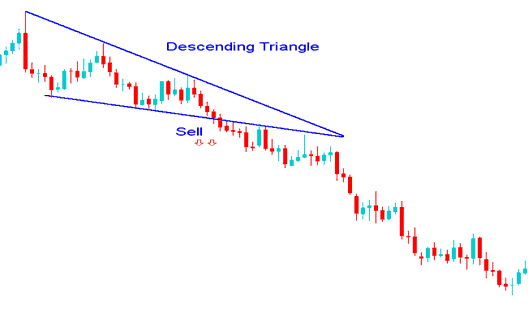
A descending triangle forms in downtrends. It signals gold prices will keep falling.
This shows a support zone where sellers push down each time. They lower it bit by bit. Once it breaks, gold price keeps falling.
Support holds the market from falling further for a time. The downward line above the pattern shows bears are still active. Breaking below the lower line gives a sell signal in a falling triangle. It points to more selling ahead.
Found within a XAUUSD down-wards trend, the descending triangle pattern forms/develops as a consolidation period within the down trend and shows downside continuation will follow.

The market created a shape like a descending triangle while it was going down, which made people sell even more and the gold trend kept going down. The signal to sell is when the price goes below the lower slanted line, as the selling starts again.
Bull Flag/Pennant
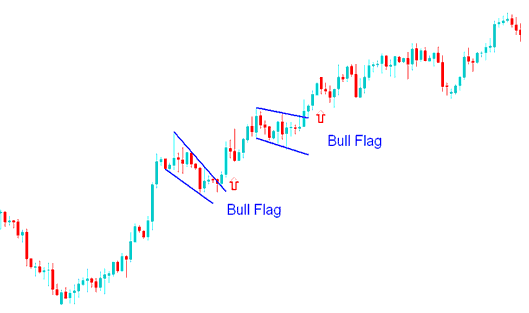
This pattern creates a rectangle shape. Two parallel lines form support and resistance until price breaks out. Flags often tilt rather than stay flat.
The bull flag is found when things are usually going up. In this setup where things keep going in the same direction and the price goes back a little, it's a small fallback with gold prices moving closely together that tilts down a bit. The moment to buy is when the price goes above the top line of the flag. The flag part has highs and lows that can be linked by small lines that are next to each other, making it look like a small channel.
The pennant pattern typically appears midway through an ascending bullish trend: following a breakout, a price movement comparable in distance to the flagpole's height is anticipated.

The bull pennant illustrated earlier represented a brief consolidation as the market regained strength for a breakout. Once the upper boundary was surpassed, a continuation trading signal was confirmed.
Bear Flag/Pennant
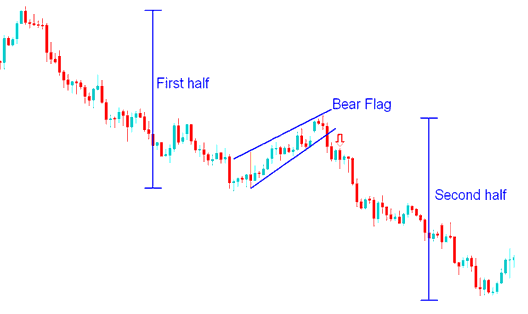
This pattern appears during a decline in market trajectory. The bear flag represents a continuation formation where the price experiences a modest pullback characterized by confined gold price action tilted slightly upward. The technical signal to sell occurs when the price breaches the lower boundary of this inverted flag structure. The pennant element involves peaks and troughs that can be connected by two slight, parallel lines, creating the appearance of a narrow consolidation channel.

The bear pennant up there? That was just the market taking a breather before more selling came in. Once the price broke below the lower line, that confirmed the continuation signal.
Explore Further Programs & Instruction Sets:
- MT4 Automatic Forex System Online
- What's Bollinger Band Width Trading Indicator?
- Analysis of Classic Bullish and Classic Bearish RSI Divergence for Gold (XAU/USD)
- Calculating Pip Values in MT4 for Small Accounts
- How to Place William % R Technical Indicator in Forex Chart
- What is the Value of 100 Pips for Standard Account?
- ADX Indicator How to Use ADX Indicator Lesson Tutorial
- Trading Approaches and Methods Specifically for the SMI20 Index
- Advantages of Forex Over Equity & Stocks Markets
- How Do You Analyze/Interpret and Print Charts Using MT4?
