Best MACD for 4 Hour XAUUSD Chart
Adding MT4 MACD Indicator
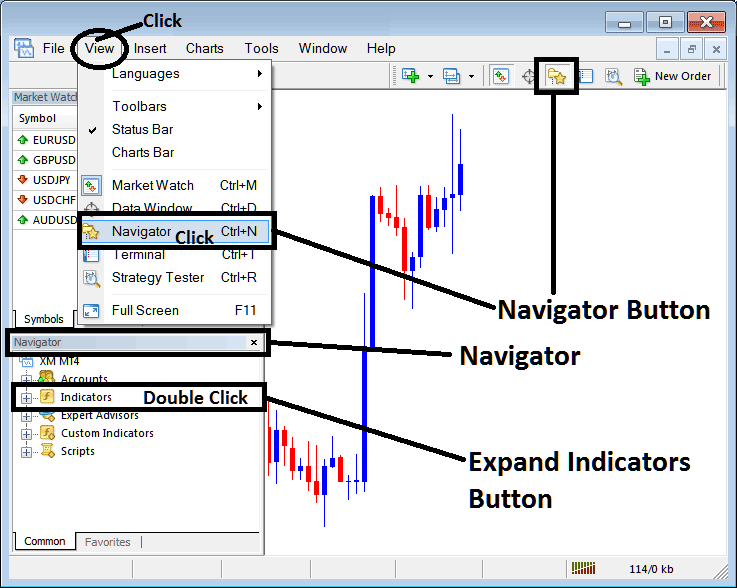
Step 1: Open the Navigator Window Panel on Gold Trading Platform
Open Navigator window as illustrated & shown below - Go to 'View' menu (then click) & then select 'Navigator' window (click), or From the Standard Tool Bar click the 'Navigator' button key or press short cut keyboard keys 'Ctrl+N'
On Navigator window panel, select 'Technical Indicators', (DoubleClick)
Best MACD for 1H Gold Chart - Best MACD for 4 Hour Gold Chart - Best MACD for Daily Chart XAUUSD
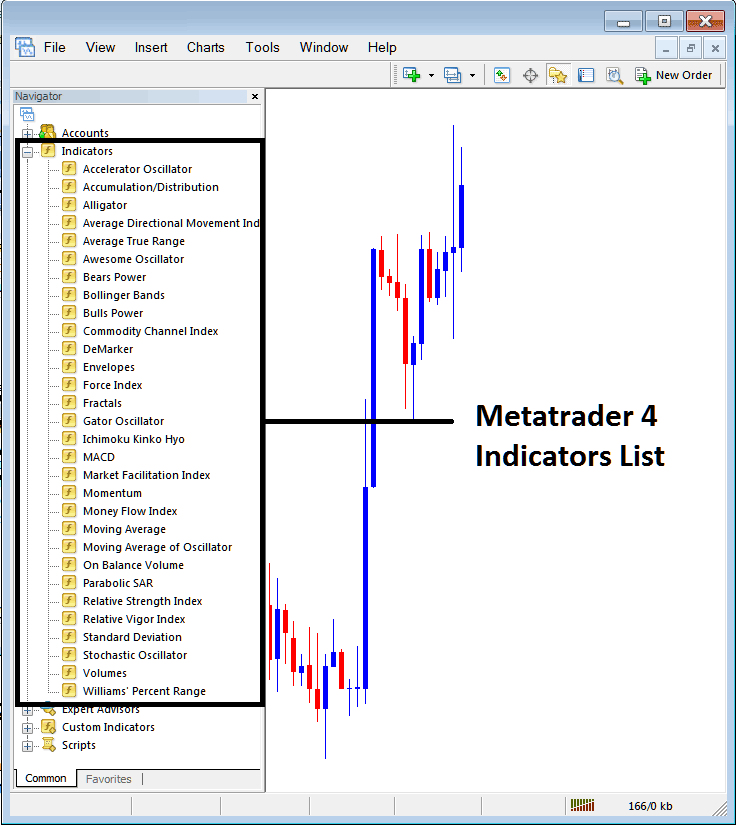
Step 2: Expand the XAUUSD Indicators Menu on the Navigator
Expand the technical indicators window menu by clicking the expand button marker (+) or double click the 'indicators' menu, after this the button will appear as (-) and will now display a list as shown below - select the MACD indicator from this list of xauusd indicators so as to add the MACD technical indicator on the gold chart.
Best MACD for 1 Hour Gold Chart - Best MACD for 4 Hour Gold Chart - Best MACD for Daily Chart XAUUSD
How to Add Custom MACD XAUUSD Indicator to MT4
If the technical indicator you want to add is a custom MACD indicator - for example if the MACD indicator you want to add is a MACD custom indicator you will need to first add this custom MACD indicator in MetaTrader 4 software and then compile custom xauusd trading MACD technical indicator so that the new added MACD custom xauusd indicator appears on the listing of custom xauusd indicators in MetaTrader 4 software.
To learn how to install MACD indicator in MetaTrader 4, how to add MACD indicator window to MT4 and how to add xauusd trading MACD custom indicator on MT4 - How to add a custom MACD xauusd trading Indicator on MetaTrader 4.
MACD XAUUSD Trading Indicator Described
MACD XAUUSD Technical Analysis and MACD Trading Signals
The MACD indicator is one of the simplest, reliable, & most commonly used technical indicators.
MACD is a momentum oscillator and also a xauusd trend following indicator.
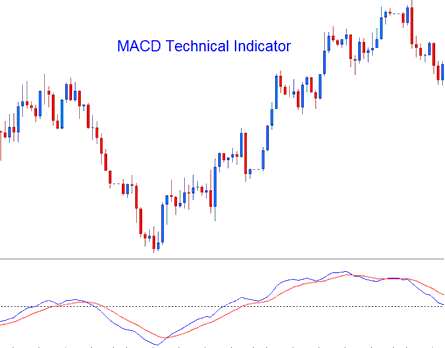
Construction of MACD Indicator
Construction of this MACD technical indicator calculates the difference between two moving averages & then draws that as the 'Fast' line: the a second 'Signal' line is then calculated from the resulting 'Fast' line and then plotted on the same panel window as the 'Fast' line.
- 'Fast' line - Blue Line
- 'Signal' line - Red Line
The 'standard' MACD indicator values for the 'Fast' line is a 12-period exponential moving average & a 26-period exponential moving average & a 9-period exponential moving applied to the fast line, this draws the 'Signal' line.
- MACD Fast-line - difference between 12 & 26 exponential moving averages
- MACD Signal-line - moving average of this difference of 9-periods
Best MACD for 15 Min Gold Chart - Best MACD for 5 Minute XAUUSD Chart
MACD Gold Technical Analysis and How to Generate XAUUSD Trading MACD Trading Signals
The MACD indicator is a commonly used as xauusd trend following indicator & works most effectively when analyzing xauusd trending gold price movements. The three common strategies of using MACD indicator to generate xauusd trading signals are:
Crossovers Gold Trading Signals:
MACD Fast-line, MACD Signal Line Crossover:
- A buy signal gets generated when MACD Fast line crosses above the MACD Signal line
- A sell trading signal is generated when MACD FastLine crosses below the MACD Signal-line.
However, in a strong xauusd trending market this signal gives a lot of whipsaws, the best xauusd trading MACD cross-over to use would thus be the MACD Zero Line Crossover Signal that's less prone to xauusd trading whipsaws.
MACD Zero Line Crossover Signals:
- When the MACD FastLine crosses above the MACD zero center line a buy trading signal is generated.
- when the MACD FastLine crosses below the MACD zero center line a sell trading signal is generated.
MACD Divergence XAUUSD:
Looking for divergences between the MACD indicator & gold price can prove to be very effective in spotting potential xauusd trend reversal and/or trend continuation points in gold price movement. There two types of MACD divergences:
- MACD Classic Divergence Trading Signals
- MACD Hidden Divergence Trading Signals
MACD Overbought Gold Trading Levels & MACD Oversold XAUUSD Trading Levels:
MACD indicator is also used to identify potential overbought & oversold levels in gold price action movements.
These overbought & oversold levels are generated if the shorter MACD Lines separate dramatically from the median, this is a signal that gold price action is over extending and it will soon return to more realistic areas.
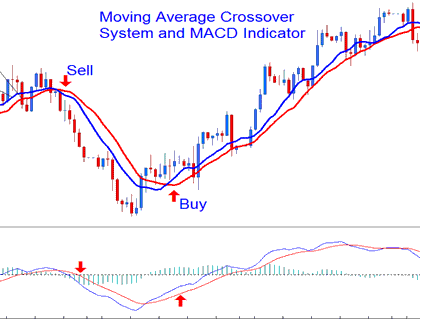
MACD & Moving Average Crossover Gold System
MACD technical indicator can be combined with other indicators to form a gold system. A good MACD indicator combination is with the Moving Average cross over xauusd system. A xauusd signal is generated when both gold technical indicators give a trade signal in the same direction.
Best MACD for 15 Min Gold Chart - Best MACD for 5 Minute XAUUSD Chart


