Best ADX for 4 Hour XAUUSD Chart
How to Add ADX Gold Indicators in MT4 Gold Charts
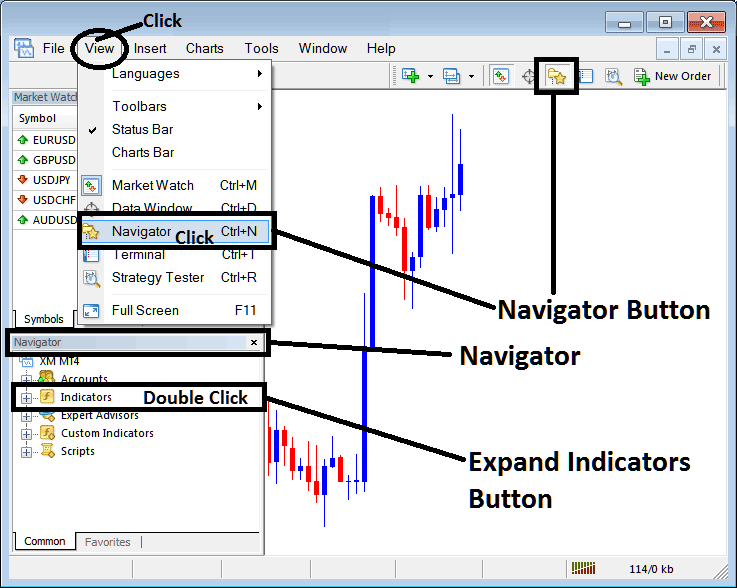
Step 1: Open the Navigator Window Panel on XAUUSD Trading Platform
Open Navigator window as illustrated & shown below - Go to 'View' menu (then click) & then select 'Navigator' window (click), or From the Standard Tool Bar click the 'Navigator' button or press keyboard short cut keys 'Ctrl +N'
On Navigator window panel, select 'Technical Indicators', (DoubleClick)
Best ADX for 1 Hour Gold Chart - Best ADX for 4 H XAUUSD Chart - Best ADX for Daily Chart XAUUSD
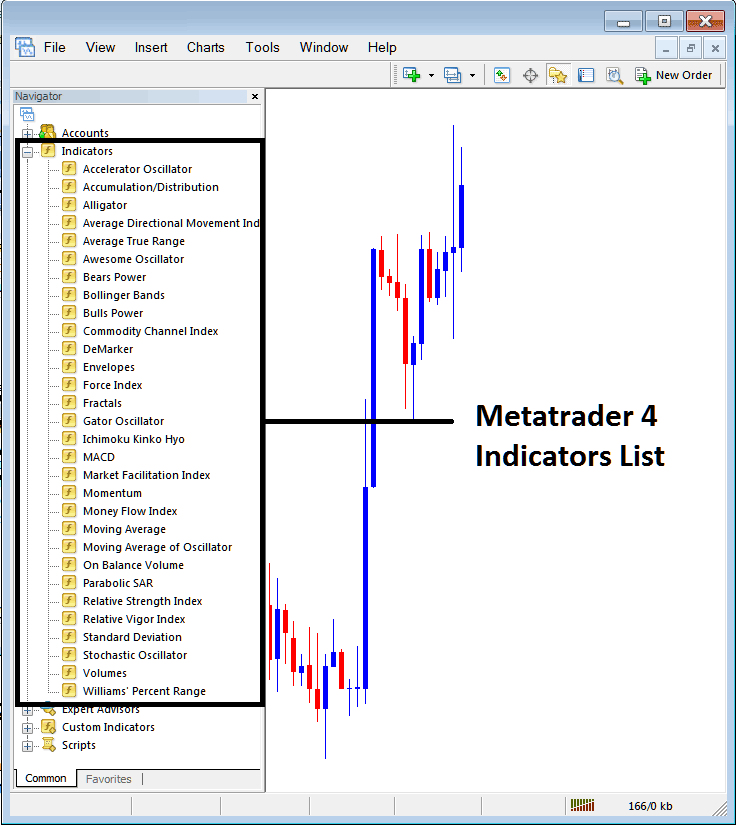
Adding ADX MT4 Indicator
Expand the menu by clicking the expand button marker (+) or double click the 'indicators' menu, after this the button will appear as (-) and will now display a list as shown below - select the ADX indicator from this list of xauusd indicators so as to add the ADX indicator on the gold chart.
Best ADX for 1H Gold Chart - Best ADX for 4 H XAUUSD Chart - Best ADX for Daily Chart XAUUSD
How to Add Custom ADX XAUUSD Indicator to MT4
If the ZDX xauusd technical indicator you want to add is a custom indicator - for example if the ADX technical indicator you want to add is a custom ADX indicator you will need to first add this custom ADX technical indicator in the MT4 software and then compile custom ADX indicator so that the newly added ADX custom indicator pops up on the list of custom indicators in MetaTrader 4 software.
To learn how to install ADX indicators on MT4, how to add ADX indicator window to MT4 and how to add ADX custom indicator on MT4 - How to add custom ADX xauusd trading Indicator on MetaTrader 4.
ADX Gold Technical Indicator Described
ADX Gold Technical Analysis & ADX Trading Signals
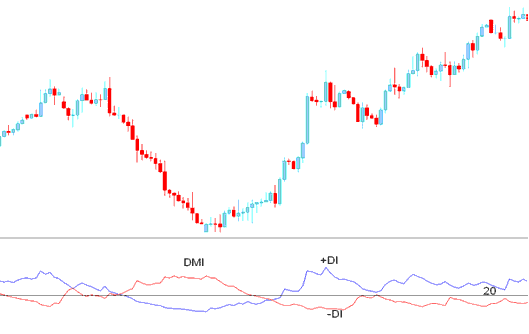
ADX indicator is a momentum indicator used to determine the strength of gold price trend: ADX indicator is derived from the DMI - Directional Movement Index which has two lines.
+DI - Positive Directional Movement Index
–DI - Negative Directional Movement Index
ADX is calculated by subtracting these 2 values and applying a smoothing function.

Best ADX for 1H Gold Chart - Best ADX for 4 H XAUUSD Chart - Best ADX for Daily Chart XAUUSD
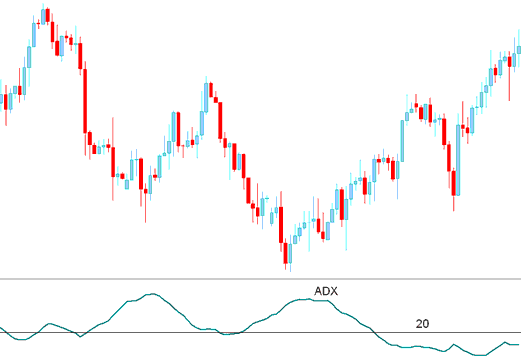
The ADX is not a directional xauusd technical indicator but a measure of the strength of the gold price trend which has a scale of Zero to 100.
Higher the ADX technical indicator value the stronger the xauusd trend.
ADX value of below 20 indicates that the gold price isn't trending but moving in a range.
ADX value of above 20 confirms a buy or sell signal and indicates a new xauusd trend is emerging.
Values above 30 indicates a strong xauusd trend.
When ADX turns down from above 30, it signals that the current xauusd trend is losing momentum.
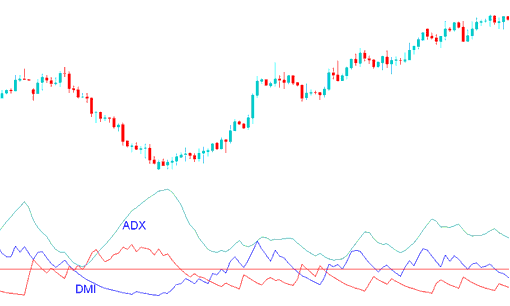
ADX combined with DMI Indicator
Since the ADX alone is a directionless indicator it is combined with the DMI index to determine the direction of the gold price trend.
Best ADX for 15 Minute Gold Chart - Best ADX for 5 Minute Gold Chart - Best ADX for 1 Minute Chart XAUUSD
ADX and DMI Index
Best ADX for 15 Minute Gold Chart - Best ADX for 5 Minute Gold Chart - Best ADX for 1 Minute Chart XAUUSD
When the ADX is combined with DMI index a trader can determine the direction of the trend and then use the this ADX indicator to determine the momentum of the prevailing xauusd trend direction.
ADX XAUUSD Technical Analysis & How to Generate Trading Signals
Buy Trading Signal
A buy signal gets generated when +DI is above –DI, and the ADX technical indicator is above 20
The Exit gold signal is generated when the ADX indicator turns down from above 30.
Best ADX for 15 Minute Gold Chart - Best ADX for 5 Minute Gold Chart - Best ADX for 1 Minute Chart XAUUSD
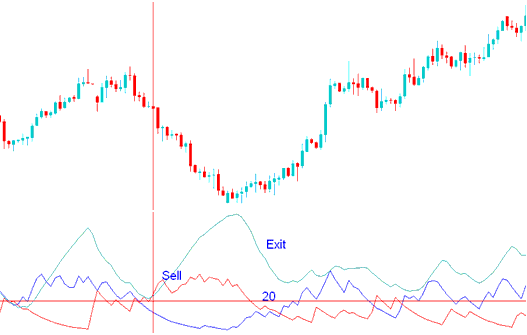
Sell Trading Signal
A sell signal gets generated when –DI is above +DI, and the ADX technical indicator is above 20
The Exit gold signal is generated when the ADX indicator turns down from above 30.
Best ADX for 15 Minute Gold Chart - Best ADX for 5 Minute Gold Chart - Best ADX for 1 Minute Chart XAUUSD


