How to Draw XAU/USD Fibonacci Extension Levels on MT4 Platform Software
These steps show how to add Fibonacci Expansion lines on the MT4 platform. They also cover changing its options. Plus, the guide explains trading gold with this method.
How to Set This Fib Expansion Levels Tool on MT4 Platform Software
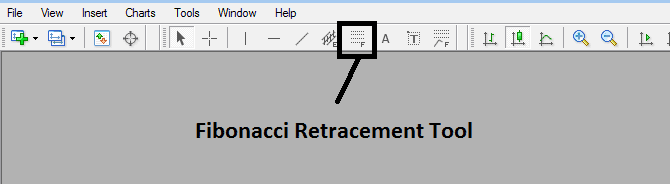
Procedure: This particular tool is not visible by default in the standard MT4 configuration. Should the corresponding button not appear on your MetaTrader 4 platform (no download is necessary for this technical indicator), locate the "MT4 Line Studies Toolbar" depicted below and execute the subsequent steps:
MT4 Line Studies Toolbar
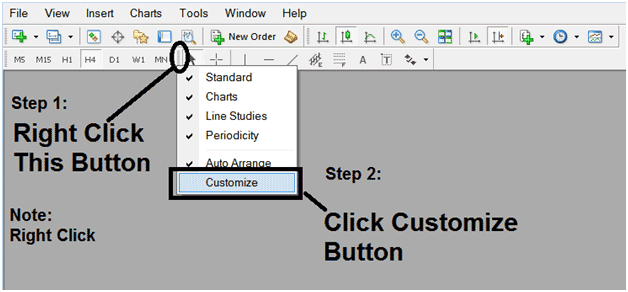
Customize Line Studies Toolbar
RightClick the Customize button (illustrated below) >>> A drop-down menu appears, Select & Choose Customize >>>
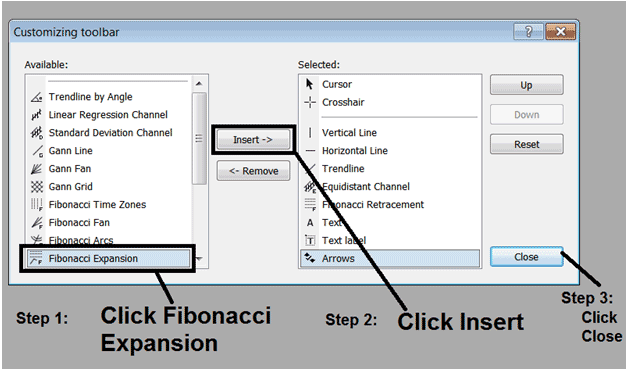
Place and Add This Tool on MetaTrader 4 Software Platform
Choose the extension tool from the pop-up window that then will appear >>> Click Insert button >>> Press Close. (Shown Below)
Fib Expansion Tool Added
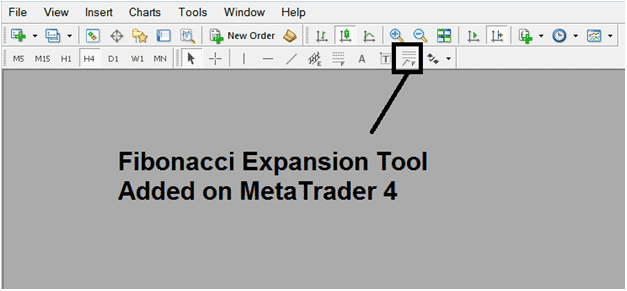
Fib Expansion Levels Tool Added to MT4 Platform
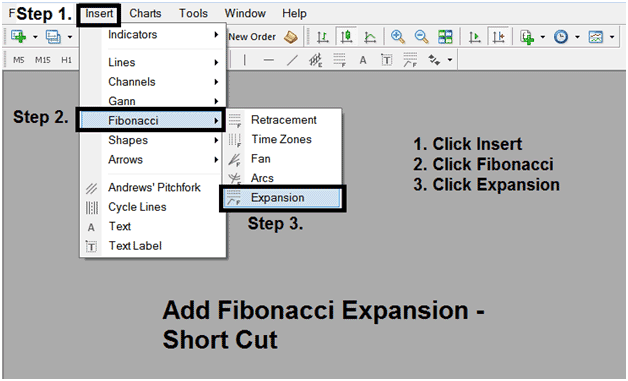
Shortcut of How to Set Fibonacci Expansion Tool
You also can use this short cut instead of the above method, do this:Click "Insert Menu"Click FibonacciClick Expansion
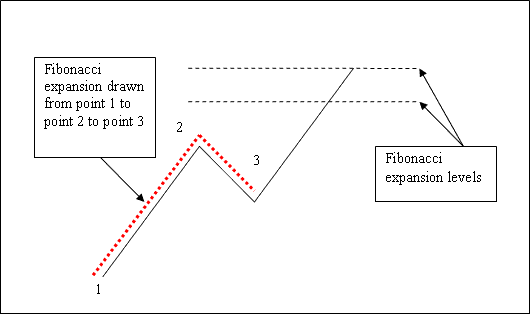
Steps on How To Draw Fibonacci Extension Levels
Steps: Once you as a trader have added this Fib expansion button, you can draw this tool by selecting it & drawing it on a Gold price chart. The three chart points will be tagged 1, 2 & 3, select the Fibonacci indicator, place the indicator on point 1 and while still holding down the mouse button drag the mouse up to point tagged 2.
How To Draw Fibonacci Extension Levels on a Gold Price Chart
How to Adjust This Tool on a XAU/USD Chart
Steps: After you, as a trader, have made this Fib extension trading indicator, you might need to adjust one point or another to the exact place where you want it. These three chart points are marked 1, 2, and 3, & these are used to change the settings after this Fib extension indicator is made on a Gold price chart.
To modify the settings, double click on the technical indicator, which is represented by dashed lines (as shown above). This action will result in three cursor points marked as 1, 2, and 3, enabling you to manipulate these points in order to adjust the indicator to fit your price chart accordingly (simply click on the desired point and move it).
Access Further Subjects and Learning Materials:
- How Can I Analyze/Interpret FX Price Action in Trading?
- One of the Best Forex Broker for Beginner Traders
- Best FX Forex Pairs for Beginners Traded in Forex Market
- What's US 500 Index in FX Trade?
- What's FX Trend-Lines Technical Indicator MetaTrader 4 Trade Platform?
- How to Open a Demo MT4 XAU/USD Account in MT4 Software Platform
- Transforming Your Forex Psychology Mindset To Improve Your Forex
- How Do I Calculate Forex Pips Values for Standard Forex Accounts?