Fib Drawing on Gold Trading Charts Exercises
These exercises offer more ways to trade and draw Fibonacci retracements and expansions. Your first step is to spot the direction of the XAUUSD price trend. Next, decide if the tool is for retracement or expansion. Then learn how to draw it. Practice on an XAUUSD chart with a demo account.
Tasks:
Figure out the direction of the Gold price trend
Determine if the Fib is retracement or extension
Figure how it's drawn
Practice drawing retracement or expansion on a Gold price chart.
To get gold trading charts, download the MetaTrader 4 XAUUSD platform from any online broker and select Gold as your financial instrument.
After downloading MetaTrader 4, go to the "insert" menu in the top left. From the dropdown, select Fibonacci. Pick retracement or extension. Draw it as shown in past lessons on Fibonacci Expansion and Retracement. Then complete these exercises.
Fib Retracement Levels & Fib Expansion Levels Exercise
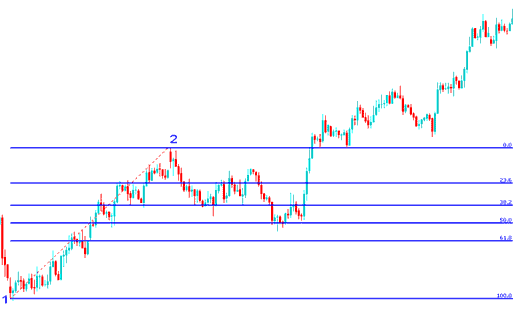
Exercises 1:
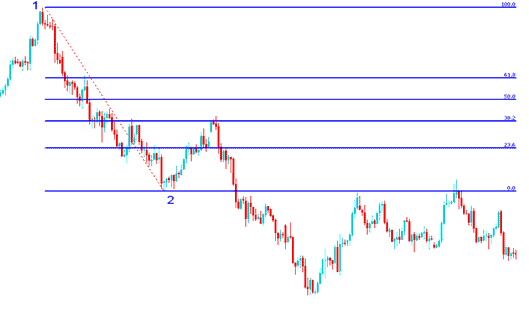
Training Exercises 2:
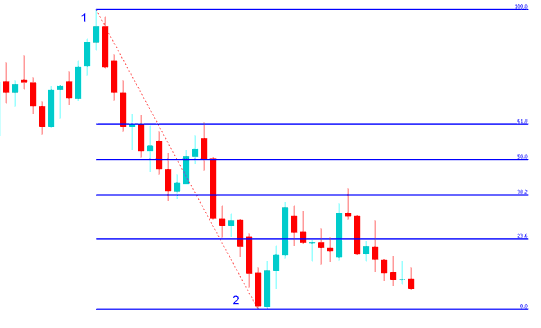
Exercises 3:
Training Exercises 4:
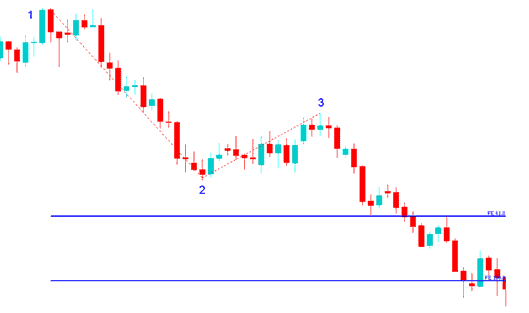
Hint: point 1 to point 2 follows the market trend direction
Hint: Retracement has points 1 & 2
Hint: Extension has point 1, 2 & 3
Get More Tutorials and Guides & Lessons:
- How to Use the Bar Chart on MT4
- Setting Up the Chande Trendscore Expert Advisor (EA)
- IBEX Course Tutorial Index IBEX Stock Index Trading Strategy Guide
- XAU/USD Platforms & XAU USD Broker Accounts
- How Do I Start a Forex Live Account: What Does a Real Trading Account Look Like?
- How Do You Trade Symbol in MetaTrader 4?
- EUR USD Pip Size Overview
- How to Do Forex Practice and Learn Trade the Currency Market
- Where Prices Stop & Reverse: Signals to Buy or Sell