What's Rectangle Consolidation Chart Patterns in CFD?
Trading CFDs Identify a Rectangle Consolidation Trading Pattern in CFD
The Best Trading Patterns Tutorial for Beginners - How to Identify & Trade Rectangle Consolidation Chart Pattern
CFDs Patterns for Day Trading - Trading CFD Patterns Guide
This Rectangle Consolidation patterns charts guide explains how to identify cfd patterns - identifying cfd chart patterns is the first step when it comes to learning how to trade with Rectangle Consolidation cfd chart patterns in CFD.
Rectangle Consolidation cfd price patterns commonly form on CFD charts and this chart pattern analysis guide explains how to trade & analyze cfd charts using Rectangle Consolidation cfd trading patterns.
Rectangle Trading Pattern
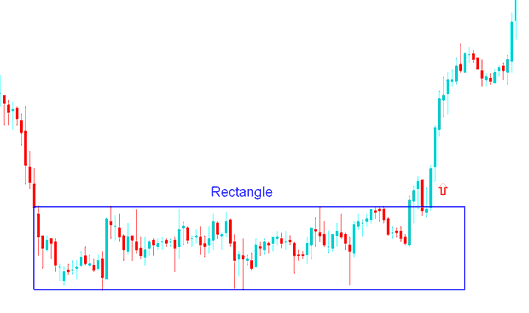
A Rectangle consolidation pattern is a trading range with narrow cfd price action that forms a consolidation phase in CFD market. The trading range is defined by 2 parallel cfd trend lines which are horizontal and show the presence of support and resistance. This cfd pattern is drawn on a cfd chart using a rectangle, therefore the name rectangle chart pattern.
For this rectangle consolidation chart pattern, cfd price forms multiple highs and lows that can be connected with horizontal cfd trendlines that are parallel to each other. This cfd pattern forms over an extended period of time giving the cfds chart pattern its rectangle shape.
A breakout of cfd price action from this rectangle consolidation chart pattern forms when either of the horizontal line is penetrated and the trading range of this rectangle is broken. An upside breakout of the rectangle consolidation chart pattern is a buy signal. A downside breakout of the rectangle consolidation chart pattern is a sell signal.
Rectangle Consolidation Chart Pattern - What is Rectangle Consolidation Chart Patterns in CFD?
CFD Price Breaks the consolidation range after sometime & continues to move upward after an upward CFD market breakout.


