What is Head and Shoulders Chart Patterns in CFD?
Trading CFDs Identify a Head and Shoulders Pattern in CFD
The Best Trading Patterns Tutorial for Beginners - How to Identify and Trade Head & Shoulders Chart Pattern
CFDs Patterns for Day Trading - Trading CFD Patterns Guide
This Head & Shoulders patterns charts tutorial explains how to identify cfd chart patterns - identifying cfd patterns is the first step when it comes to learning how to trade with Head and Shoulders chart patterns in CFD.
Head and Shoulders cfd price patterns commonly form on CFD charts and this pattern analysis tutorial explains how to trade & analyze cfd charts using Head and Shoulders chart patterns.
Head & Shoulders Trading Pattern
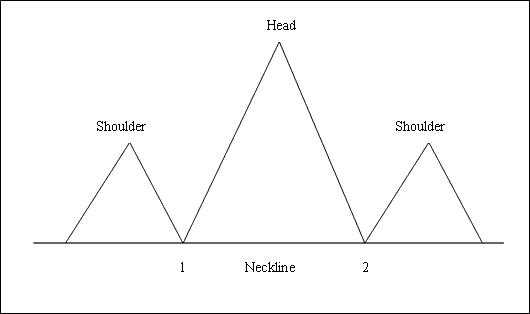
Head & Shoulders Pattern is a reversal trading pattern which forms after an extended CFD upward cfds trend. Head and Shoulders Pattern is made up of three consecutive peaks, the left shoulder, the head and the right shoulder with two moderate troughs between the shoulders.
This Head and Shoulders Pattern is considered complete once cfd price penetrates & moves below the neck line, which is plotted by connecting these two troughs in between the shoulders.
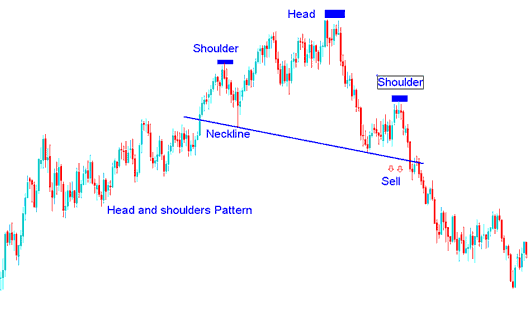
To go short, CFD traders place their sell stop orders just below the neck line region.
Summary:
- This Head and Shoulders Chart Pattern forms after an extended move upward
- This Head & Shoulders Pattern formation indicates that there will be a reversal in cfd market
- This Head & Shoulders Chart Pattern formation resembles head with shoulders thus its name.
- To draw the neckline we use chart point 1 & point 2 as displayed below. We also extend this line in both directions.
- We sell when price breaks-out below neckline: see the trading chart below for explanation.
What's Head and Shoulders Chart Patterns in CFD?
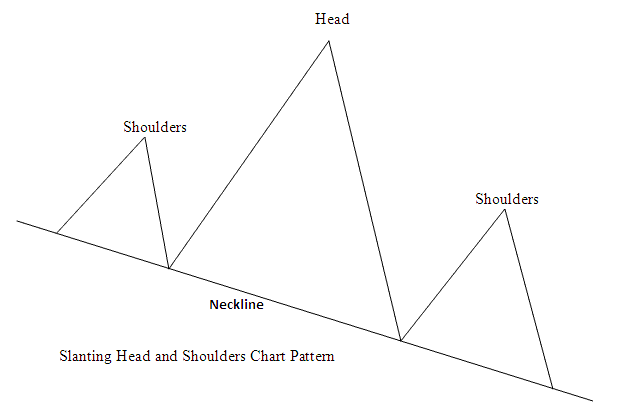
Or the head & shoulders pattern can also form on a slanting neckline, like the cfd examples explained & illustrated below:
Trading CFDs Identify a Head and Shoulders Pattern in CFD?
Example of Head & Shoulders Pattern on a CFDs Chart
Trading CFDs Identify a Head and Shoulders Pattern in CFD?
This Head and Shoulders Chart Pattern can also be formed on a slanting neckline, like the one above, the neckline doesn't have to be necessarily horizontal.


