MACD CFD Indicator Oscillator CFD Technical Analysis Fast Line and Signal Line
MACD CFD indicator is used in various ways to give technical analysis data.
- MACD center-line crosses indicate bullish or bearish markets: below zero is bearish, above zero is bullish.
- MACD Crossovers indicate a buy or sell signal.
- Oscillations can be used to indicate oversold and overbought regions
- Used to look for divergence between cfd price and indicator.
Construction of MACD Indicator
The MACD indicator is constructed using two exponential moving averages and this cfds technical indicator plots two lines. The two default exponential moving averages used are 12 and 26. Then a smoothing factor of 9 is also applied when drawing the MACD indicator.
Summary of how MACD indicator is drawn
MACD uses 2 EMAs + a smoothing factor (12, 26 Exponential Moving Averages & 9 smoothing periods)
MACD technical indicator only plots two lines - the MACD fast line and the MACD signal line
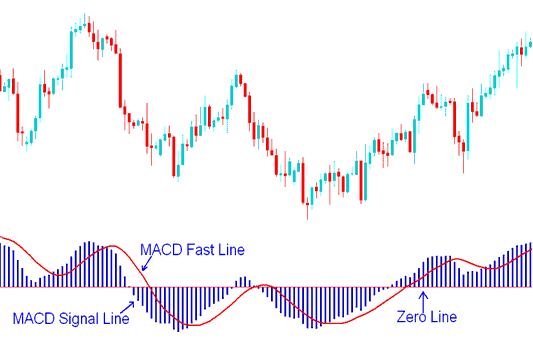
MACD Lines - MACD Fast Line & MACD Signal-Lines CFD Signals
- The FastLine is the difference between the 26 EMA and 12 EMA
- The Signal Line is the 9 period moving average of the MACD fast line.
Implementation of MACD Indicator
MACD indicator implements the MACD line as a continuous line while the signal line is implemented as a histogram. These two MACD LINES are then used to generate cfd signals using the crossover trading strategy method.
There is also the MACD center-line which is also known as zero mark and it's a neutral point between buyers & sellers trading the cfd trading market.
Values above the center-mark are considered bullish cfd signals while those below are bearish trading signals.
The MACD indicator being an oscillator indicator, oscillates above & below this center line.


