Trading CFD Analyze Hammer Candles Pattern
Hammer candle stick pattern is a potentially bullish candle pattern which occurs during a cfd downwards trend. It is named so because the cfd market is hammering out a market bottoms.
A hammer candle pattern has:
- A small body
- The body is at the top
- The lower shadow is two or three times length of the real body.
- Has no upper shadow or very small upper shadow if present.
- The color of the body is not important
Analyze Hammer Candles Pattern?
Technical Analysis of Hammer Candlesticks Pattern
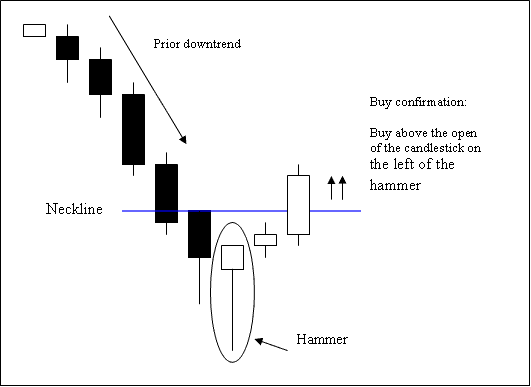
The bullish reversal buy trading signal is confirmed when a candlestick closes above the opening cfd price of the candlestick on the leftside of this hammer candlestick pattern.
Stop Loss orders should be set few pips just below the low of hammer candle-stick once a trade is opened using this candlestick pattern formation.


