How Do I Read CFD Trading Market Trends?
How Do I Read CFD Price Trends?
To read a cfd market trend you need to first of all learn what's a cfd trend & how you can identify a cfds trend on a cfd price chart.
First thing that you need to know about a cfd trading is that is the general direction of cfd prices either upwards or downwards. The cfd trend is the study & analysis of cfd price movement upward or downwards.
Cfds trading prices generally move within what is commonly known as a cfds trend. CFD price movement can either move in a downwards trend direction or an upward trend direction.
To study cfd trends - traders use cfd trend-lines to show the general direction of the trend.
A cfd trend can be upward -therefore cfd traders will draw an upward cfd trend line on the cfd chart
A cfd trend can be downwards -therefore cfd traders will draw a downward cfd trend line on the cfd chart
An upward cfd trend-line is a diagonal sloping line that slopes upwards thus its name - upwards cfd trend line
An downward cfd trend-line is a diagonal sloping line that slopes downwards thus its name - downward cfd trend line
Tutorials for Drawing a CFD Trend Line
To draw a cfd trend line - traders will need to follow the guidelines for drawing a cfd trend line
At least 2 charts points are needed to draw a cfd trend-line - when the third point touches trend-line without going through the trend-line then the trend-line is then considered as valid.
The direction of the trend line either upwards or downward will define the direction of the trend - direction can either be upward cfd trend line or downwards cfd trend line.
CFD prices should move within this trend line & cfd prices should not go past the trend-line. As long as cfd price is within the trend-line then market trend is still intact.
The cfd prices should move along the direction of the trend until such a time when the trend-line is broken. Once the trend line is broken then cfd traders will interpret this as a possible cfd trend reversal signal because cfd prices are not moving along the support levels or resistance levels provided by trend-line & thus this may mean that the cfd trend is no longer holding.
Read Market Trends - How Do I Read CFD Trading Market Trends?
When the cfd price moves up it forms higher highs & higher lows forming an upward cfd price movement. An upwards cfd trend line can then be drawn by connecting these cfd price higher lows.
To draw this upward trend line - we use support areas. To draw the upward trend-line correctly two support zones are needed.
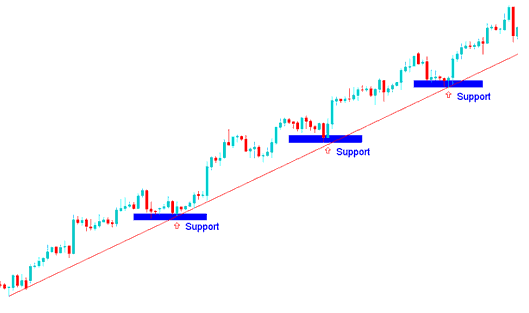
CFD Trading Read An Upward CFD Trend-Line - How Do I Read CFD Trade Chart Trends? - How Do You Analyze CFD Price Trends?
Downwards CFD Trendline MetaTrader 4 Trend Lines Technical Indicator
When it comes to learning how to draw & learning cfd technical analysis of cfd charts, you need to know that when the price is moving it forms lower lows and lower highs forming a downwards cfd price direction. These are points that are used to plot the downward cfd trendline.
To draw this downward trend - we use resistance levels and to draw a downwards cfd trend correctly 2 resistances are needed.
CFD Trading Read a Downward CFD Trend-Line - How Do I Read Market Trends? - How Do I Read CFD Trading Market Trends?
CFD Trading Read Market Trends? - How Do I Read CFD Market Trends? - How Do You Analyze CFD Trade Chart Trends? - How Do You Analyze CFD Price Trends


