CFD Trading Consolidation Break out Indicator
With CFD Trading Consolidation Break-out CFDs Chart Pattern the cfds trading market cfd price breakout can move in any direction.
CFD Trading Consolidation Break-out CFDs Chart Pattern
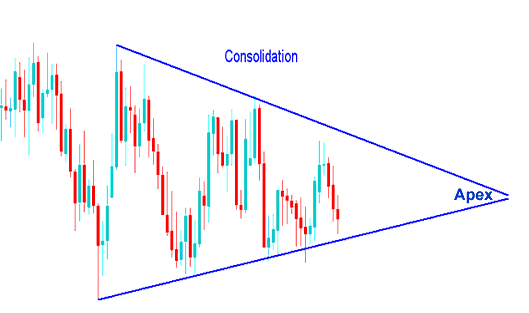
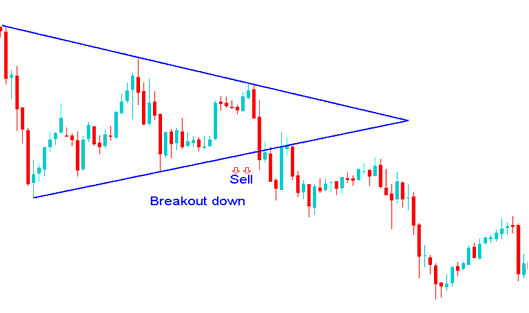
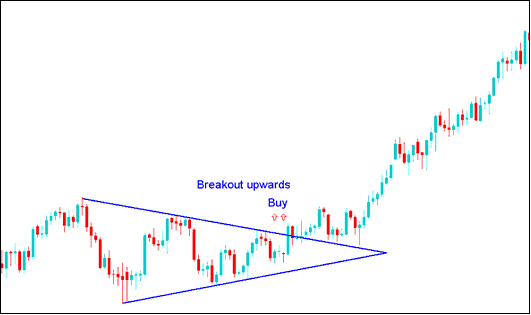
Symmetrical triangles are cfd patterns with converging trendlines that form a consolidation period of the cfd price. The technical analysis cfd buy signal from a symmetrical triangle is the upside cfd price breakout, while a downside cfd price breakout is a technical cfd sell signal. Ideally the cfds trading market breaks out from a consolidation chart pattern - symmetrical triangle prior to reaching the apex of the triangle.
CFD Trading Trend Lines can be drawn connecting the lows and highs of the consolidation chart pattern phase, the trend lines formed are symmetric and converge to form an apex - cfd trading triangle pattern - cfd trading consolidation pattern. A CFD Trading Consolidation Break-out should occur somewhere between 60-80% into the cfd trading triangle chart pattern. An early or late CFD Trading Consolidation Break-out is more prone to whipsaw cfds trading signals, & therefore less reliable. After a cfd price breakout the apex of the cfd trading triangle forms support & resistance levels for the cfd price. CFD price that has broken out of the apex should not retrace past apex of the cfd trading triangle consolidation chart pattern. The apex of the triangle consolidation pattern is used as a stop loss order setting area for the open cfds trades.
When these cfd trading consolidation chart patterns form we say that the cfds trading market trend is taking a break before deciding the next direction to move.
These cfd trading consolidation patterns form when there is a tug of war between the buyers & the sellers and the cfds trading market can't decide which way to continue.
CFD Trading Consolidation Break-out CFDs Pattern - CFD Trading Consolidation Break out Indicator - Consolidation Chart Pattern CFD
However, this cfd trading consolidation chart pattern can't go on forever & just like in a tug of war one side eventually wins, looking at the CFD Trading chart below see how the consolidation eventually had a cfd trading breakout and moved in one direction - CFD Trading Consolidation Break-out CFDs Chart Pattern. Now how do you make sure you choose the winning side?
CFD Trading Consolidation Break-out CFDs Indicator MT4 CFD Software - Consolidation Indicator CFD Trading - CFD Trading Consolidation Indicator MT4 - Consolidation Chart Pattern CFD
CFD Trading Consolidation Break-out CFDs Pattern - CFD Trading Consolidation Break out Indicator - CFD Trading Consolidation Break out Indicator MetaTrader 4
Now back to our cfd trading question, how do we make sure we are on winning side of the trade?
Well we wait until the cfd price moves past one of the trend-lines of the cfd trading triangle consolidation pattern and put buy cfd orders or sell cfd orders in that direction. If cfd price cfd trading breaks the upper consolidation line we buy, if it cfd price breaks the lower consolidation line we sell.
Alternatively if you do not want to wait for a cfd trading consolidation cfd trading break out - you can use cfd trading ending orders.


