Place Bulls Power Bitcoin Indicator on Crypto Currency Chart in MT5 Platform Software
MT5 Bitcoin Software - the Bulls Power Bitcoin Indicator on a Bitcoin MT5 chart on the MT5 Software. For Analysis: Bitcoin MT5 Technical Indicator Technical analysis of bitcoin trading Bulls Power.
How to Place MetaTrader 5 Indicators in MetaTrader 5 Charts
Step 1: Open The Software Navigator Window
Open Navigator window just as is shown and illustrated below: Navigate to 'View' menu (click on it), then select and choose ' MetaTrader 5 Navigator ' panel window (click), or From Standard Tool-Bar click 'MT5 Navigator' button or press keyboard short-cut keys 'Ctrl+N'
On the MT5 Navigator window, choose "Indicators", (Double Press)
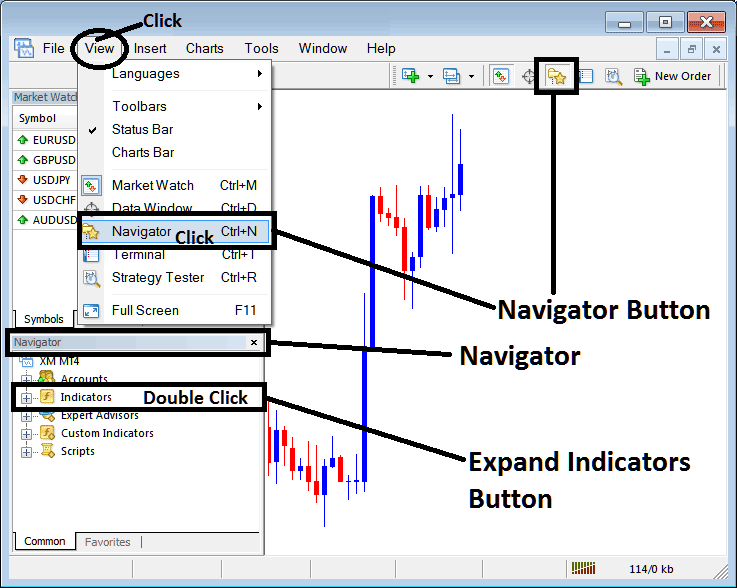
Step 2: Expand the MT5 Indicators Menu on the Navigator
Expand MT5 indicator window menu by clicking the enlarge tool button point ' + ' or doubleclick the 'indicators' menu, after this the MT5 button will then appear as (-) & will now show a list just as is shown below.

From Above window you then can add any MT5 trading indicator that you as a trader want on the MT5 btcusd crypto chart.
Setting Bulls Power Indicator on BTCUSD Chart
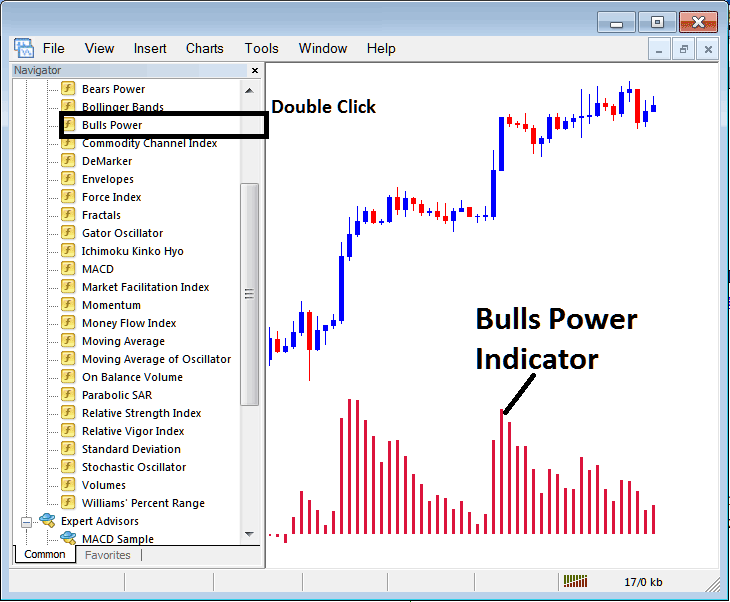
Step 1: Select and Choose the Bulls Power button on the MetaTrader 5 list of technical indicators like is shown below:
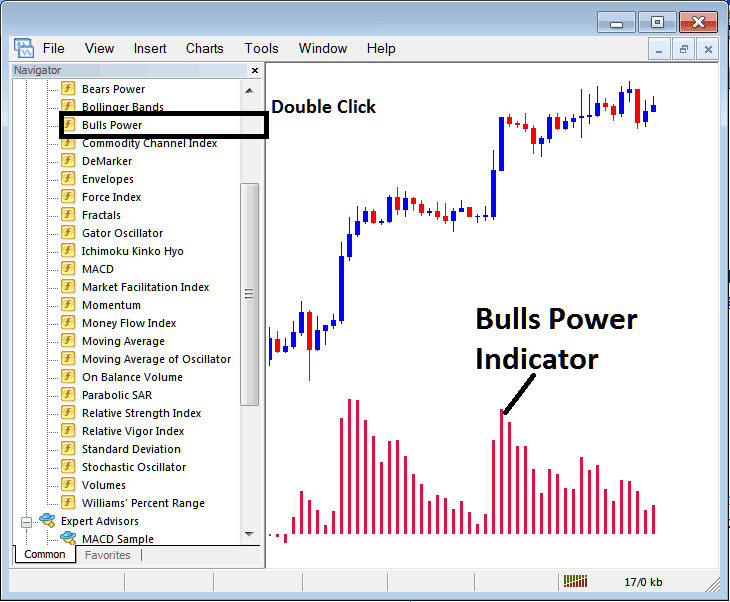
Step 2: Double-click the Bulls Power Button, & click ok button to add the indicator onto the chart just as shown below:
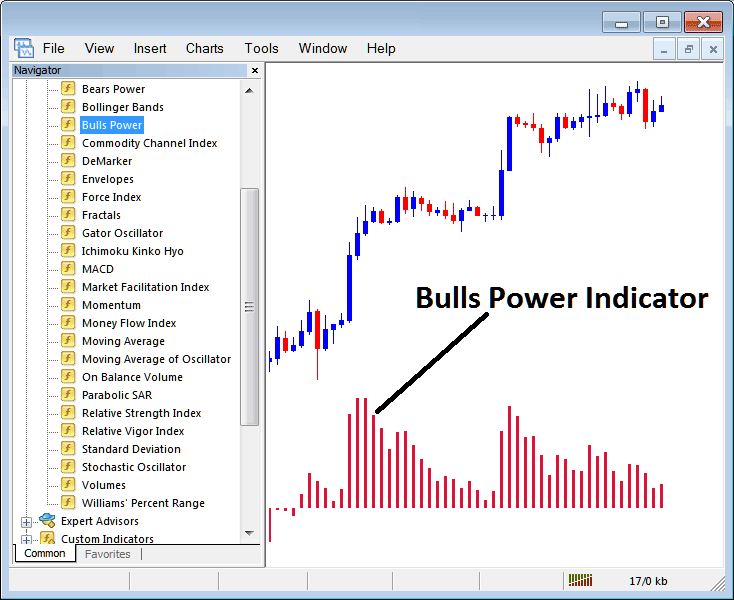
Edit Indicator Setting
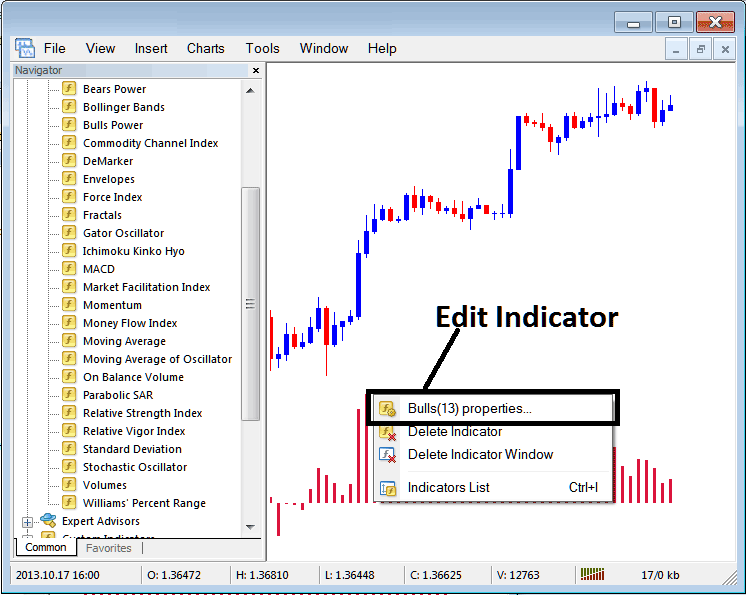
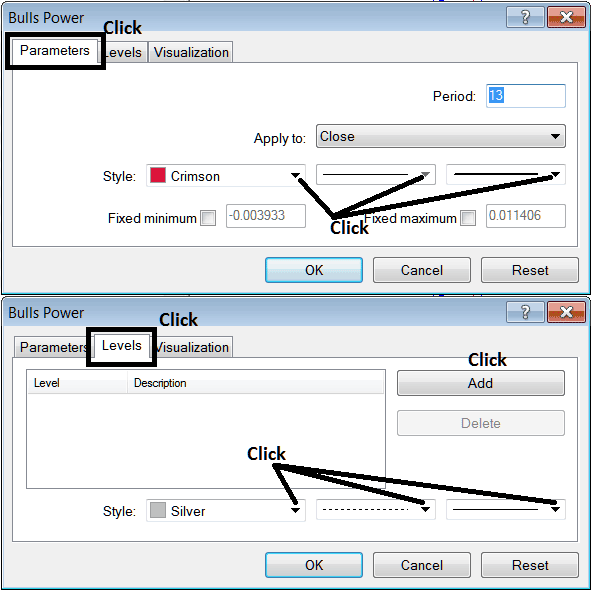
To Change Settings, right click in the Bulls Power Indicator, select properties settings & then edit property settings using pop-up menu that appears and click ok button once you change the settings.
The following panel popup appears and Trading Indicator properties can be changed & edited using this window pop-up.
Learn More Courses and Topics:
- BTC USD Trade Learn Training Courses for Beginner Traders
- Where to Find Free Online Learn Bitcoin Trade Website Guide Lesson
- How Do I Analyze BTCUSD Symbols in MT4 Platform?
- How Do I Interpret Bearish Descending Triangle Chart Patterns?
- MetaTrader 4 BTC USD Software Platform Multiple Timeframes in Chart


