Crypto 20 Pips Bitcoin Price Range MA Trading Strategy Using Moving Averages
Crypto 20 Pips Moving Average Bitcoin Systems Strategies
The 20-pip bitcoin price range moving average strategy uses the 1-hour and 15-minute cryptocurrency charts. In these timeframes, traders utilize the 100 and 200 simple moving average indicators.
On 1-hour and 15-minute charts, use 100 and 200 SMA indicators. They help spot the Bitcoin trend direction.
The 1 Hour chart time-frame looks at the long-term direction of the Bitcoin trend, either up or down, based on where the MAs Moving Averages are going. All cryptocurrency trades should follow this bitcoin trend.
Subsequently, we utilize the 15-minute cryptocurrency chart to pinpoint the optimal timing for initiating cryptocurrency trades. Bitcoin trades are only executed if the bitcoin price falls within a 20-pip band around the 200 simple Moving Average: otherwise, cryptocurrency trade positions remain uninitiated.
Bitcoin Uptrend/Bullish Market
To generate buy (bullish bitcoin indications) utilizing the 20 pip Moving Average Bitcoin approach, we should examine the 1-hour and 15-minute bitcoin chart timeframes.
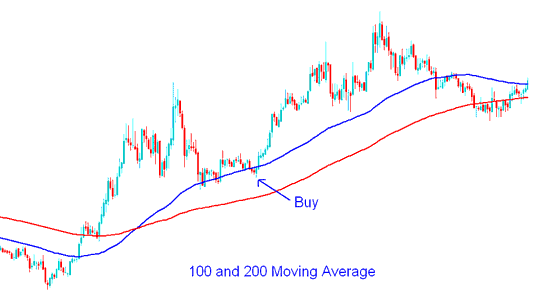
On the 1-hour chart time frame, the price of bitcoin in the cryptocurrency chart should be positioned above both the 100 and 200 simple moving averages. Subsequently, we will transition to a lower time frame, the 15-minute chart, to generate a bitcoin trade signal.
On a 15-minute Bitcoin chart, buy when price hits 20 pips above the 200 SMA. Set stop loss 30 pips below it. Adjust pips to fit your risk. But 30 pips dodges normal volatility shakeouts.
You can also open a bitcoin buy trade when the price touches the 100 simple moving average, as long as it's close to the 200 simple moving average. Usually, the 100 SMA sits within 20 pips of the 200 SMA.
100 & 200 Simple MA Bitcoin Buy Trading Signal - Moving Average Method
Bitcoin Downtrend/Bearish Market
To generate sell signals (for shorting bitcoin) using the 20-pip Moving Average Bitcoin strategy, concurrently employing both the 1-hour and 15-minute chart timeframes for bitcoin analysis is necessary.
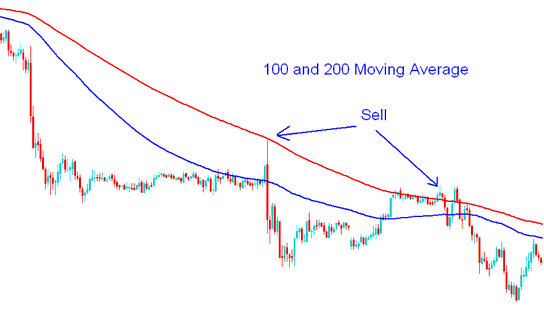
On the one-hour chart setting, the price of Bitcoin should be situated beneath both the 100-period and 200-period Simple Moving Averages. Subsequently, we transition to the fifteen-minute timeframe to generate a Bitcoin signal.
On a 15-minute chart, we start a sell bitcoin order when the bitcoin price drops 20 pips below the 200 Simple Moving Average, and we set a stoploss order 30 pips above the 200 simple MA.
100 & 200 Simple MA Bitcoin Sell Signal - Moving Average(MA) Method
In this bitcoin approach, prices often rebound from support and resistance lines. Many bitcoin traders eye these spots and enter trades at similar times.
These levels act as short-term areas where the bitcoin price might stop or find support on the charts.
profit taking and booking zone for This Strategy
Using this bitcoin plan, the bitcoin price will bounce and move in the same direction as the first bitcoin trend. This move will change somewhere between 60 and 70 pips.
The most beneficial level for realizing intended bitcoin profits would therefore be located 60 to 70 pips distant from the 200 Simple Moving Average (SMA).
Discover More Subject Areas & Training:
- How to Install EA on your MT4 BTCUSD Trade Software/Platform
- Trade BTC/USD and Add Pending Orders on MT5 iPhone App Guide
- How to create a demo account for BTC/USD trades in MetaTrader 4.
- Regulated Bitcoin Broker Review
- How Do You Add MT5 BTCUSD Trade Bulls Power on MT5 Bitcoin Chart in MT5 Platform?
- How to Install BTC/USD MT4 Trade Platform Bitcoin MT4 Platform
- Classic Divergence Trading Indicators
- How Do You Trade BTC USD & Set Take Profit BTC USD Orders in MT5 BTCUSD Charts?
- How to Use Heikin Ashi Indicator on Chart
- Awesome Oscillator Technical Bitcoin Trading Indicator


