Add moving average indicator to Bitcoin chart on MT4
This learn btcusd tutorial will explain how to place Moving Average MA of Oscillator on Crypto Currency Chart on the MetaTrader 4 Platform Software. For trading analysis: Technical analysis of bitcoin crypto trading all Indicators.
How to Add Bitcoin Indicators in MetaTrader 4 Charts
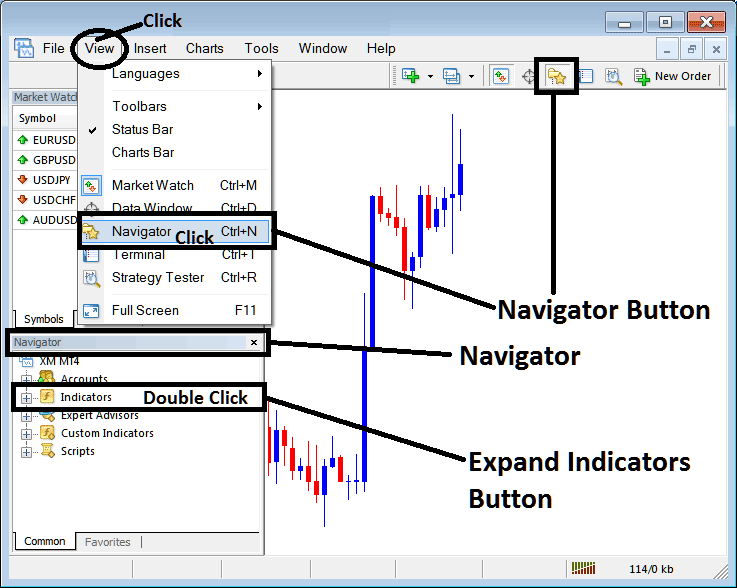
Step 1: Open The Platform Navigator Panel
Open the Navigator window panel like shown: Navigate to the "View" menu (click on it) & then choose & select the "Navigator" window (click), or From Standard Toolbar click "Navigator" button or press key board short-cut keys "Ctrl+N"
On Navigator panel, select 'Technical Indicators', (DoubleClick)
Step 2: Expand Technical Indicators Menu on the Navigator
Click the plus button next to the menu to expand it. Or double-click "indicators." The button turns to a minus, and the list appears below.
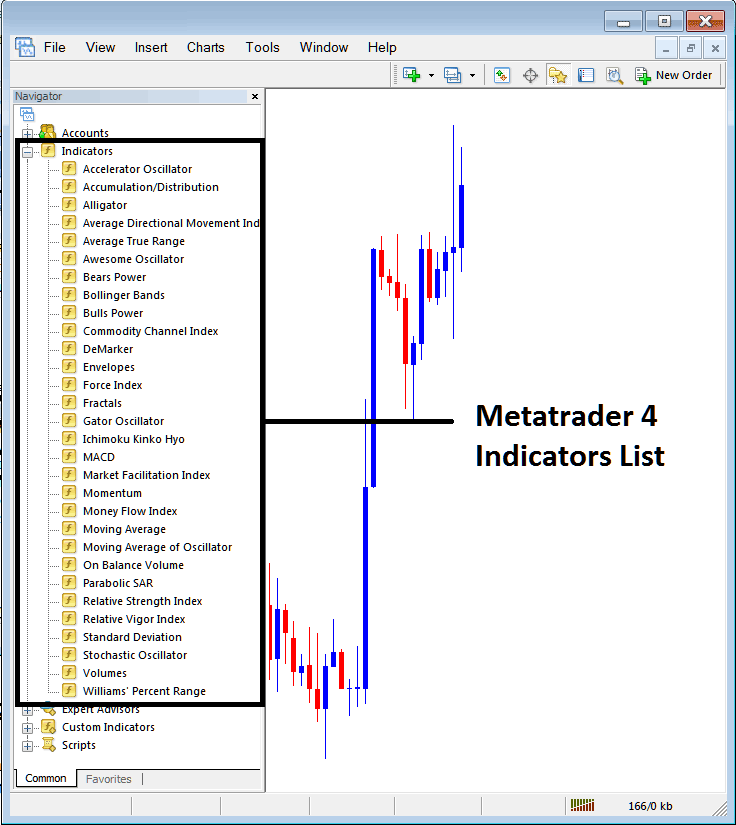
From the supervisory bar above, you can then introduce any technical analysis mechanism you prefer directly onto the bitcoin chart display.
Placing Moving Average MA of Oscillator on BTCUSD Chart
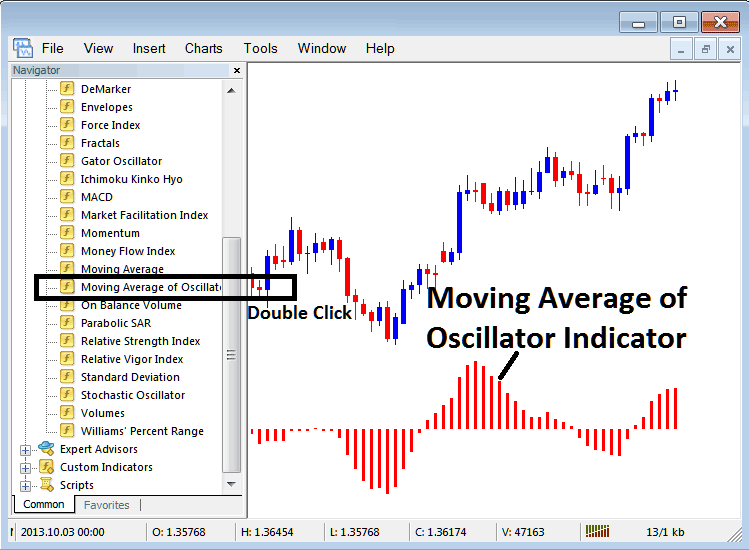
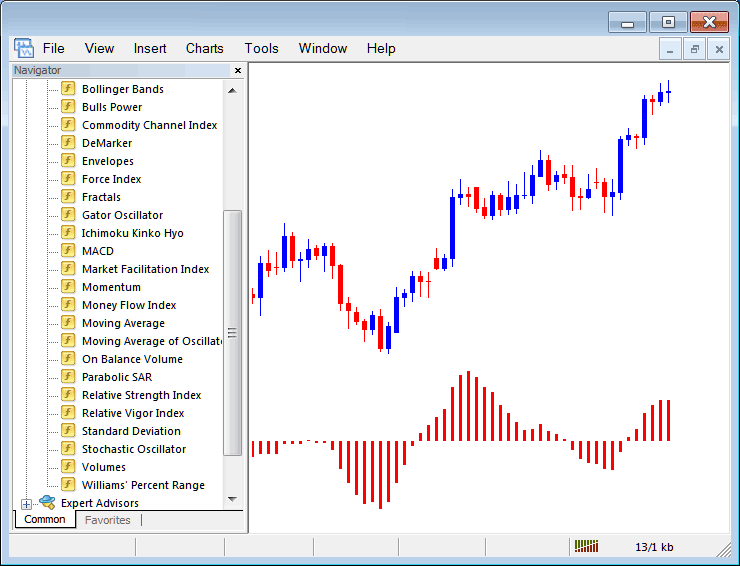
Step 1: Find the MA of Oscillator button on the MetaTrader 4 list of tools, like the image that you see here shows:
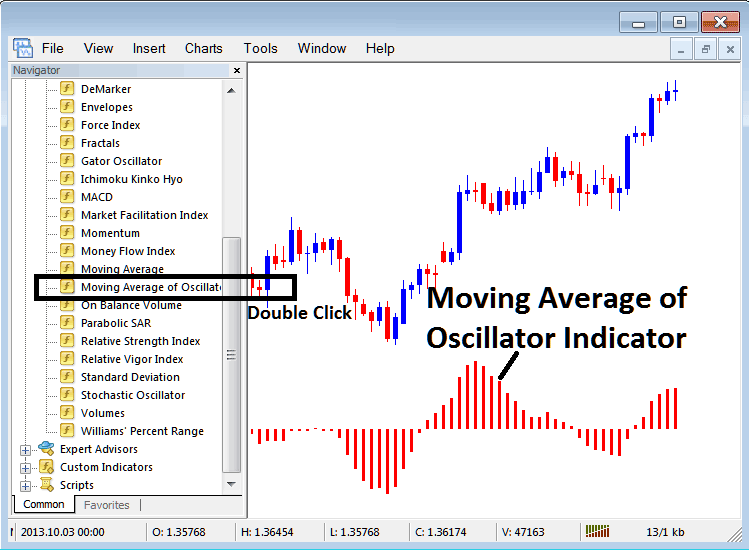
Step 2: Double Click the Button Key, & click ok to place and set the technical indicator to the chart such as shown:
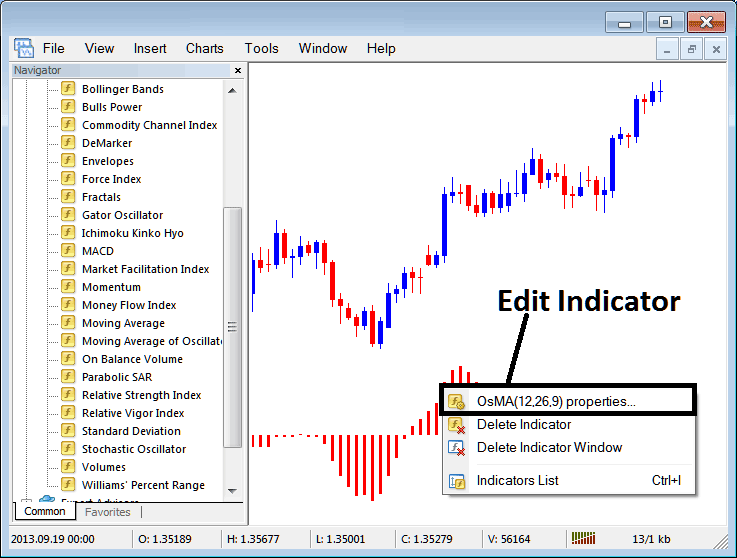
Edit OSMA Bitcoin Indicator Settings
Right-click the Indicator, choose Properties, and then change the settings from the popup window that displays to make the modifications. Finally, click OK to implement the changes.
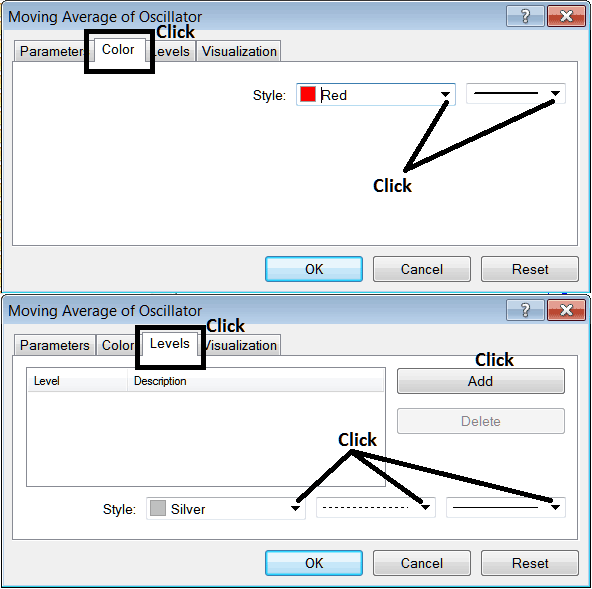
The following panel window will appear, allowing for the modification and editing of Indicator properties via this pop-up panel.
Study More Tutorials & Topics:
