Bitcoin Bollinger Band Volatility Breakout
The Bitcoin Bollinger Bands Volatility Indicator are self adjusting which means the Bollinger bands widen and narrow depending on bitcoin price volatility.
Standard Deviation is the statistical measure of bitcoin price volatility that is used to calculate the widening of the bitcoin Bollinger bands or narrowing of the bitcoin Bollinger bands. Standard deviation will be higher when the bitcoin prices are changing significantly and Standard deviation will be lower when the cryptocurrency market prices are not changing a lot.
- When the bitcoin price volatility is high the Bollinger Bands widen - Bollinger Bands Break out Trading Strategy.
- When bitcoin the bitcoin price volatility is low the Bollinger Bands narrows - Bollinger Bands Consolidation Trading Strategy.
The Bollinger Band Squeeze
Narrowing of the bitcoin Bollinger Bands is a sign of bitcoin price consolidation and is known as the Bollinger Bands Squeeze.
When the Bollinger Bands indicator display narrow standard deviation it is usually a time of bitcoin price consolidation, and this is also a bitcoin signal that there will be a bitcoin price breakout and it shows that bitcoin traders are adjusting their bitcoin trade positions for a new bitcoin trend move. Also, the longer the bitcoin prices stay within the narrow Bollinger Bands range the greater the chance of a bitcoin price breakout.
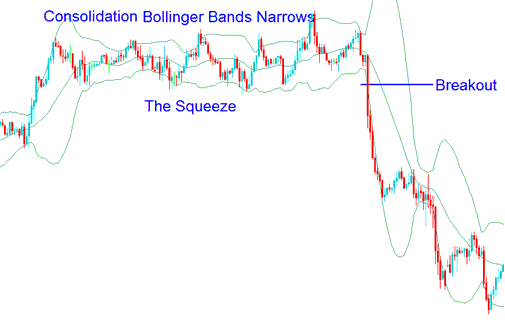
Bollinger Band Squeeze - Bollinger Bands Breakout Strategy - Bollinger Bands Consolidation Trading Strategy
BTCUSD Trading Bollinger Band Volatility Break out
The widening of Bollinger Band technical indicator is a sign of a bitcoin price break out and this is known as Bollinger Bands Bulge.
Bollinger Bands indicator that are far apart can be interpreted as a cryptocurrency signal that a bitcoin trend reversal is likely to happen. In the Bollinger Bands indicator cryptocurrency trading example illustrated below, the bitcoin Bollinger Bands get very wide as a result of high bitcoin market price volatility. The bitcoin trend reverses as bitcoin prices reach an extreme level according to statistics and the theory of normal distribution. The "Bollinger Bands Bulge" predicts the change of the trend to a bitcoin trading downwards trading trend.
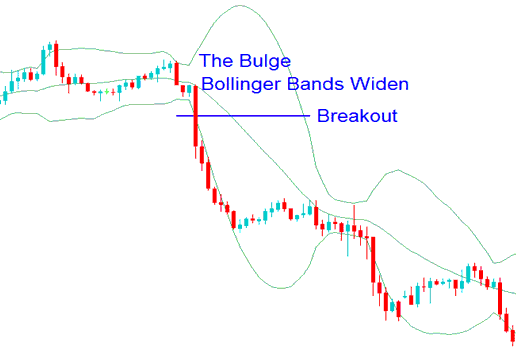
Bollinger Band Bulge - Bollinger Bands Volatility Breakout - Bollinger Bands Breakout Trading Strategy
Bollinger Band Volatility Bitcoin Trading Break out - Bitcoin Trading Analysis Using Bollinger Bands Volatility Cryptocurrency Indicator - Bollinger Bands Breakout Bitcoin Strategy - Bollinger Bands Consolidation Trading Strategy


