Bollinger Percent B Analysis Signals
Created by John Bollinger
Percent B Comes from Bollinger Bands Calculation.
This is an oscillator trading which has 3 lines - 0, 50, 100
- 0 represents lower Band
- 50 represents middle Band
- 100 represents upper Band
Percentage B oscillates between these three3 points and it shows where the price is relative to the 3 Bollinger Band.
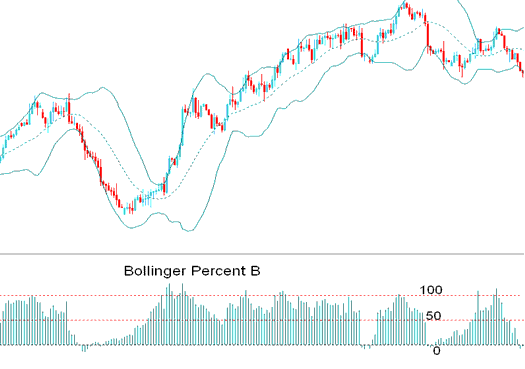
%b indicator
When the price gets to the top line, the tool hits 100: if the price goes over, the tool goes to +100.
When the price touches or checks the lower band, the oscillator gets to 0: if the price goes below the lower band, the oscillator goes to -0.
When the price tests/touches the mid band then the oscillator trading indicator will be at 50.
Calculation
Percent B = Currency Price Close - Lower Band * 100
Upper Band - Lower Band
FX Analysis and How to Generate Trading Signals
% B shows to what degree the price closes above/below any of the bands.
Buy Signal
Oscillator Values Over 50 Show Bullish Signs.
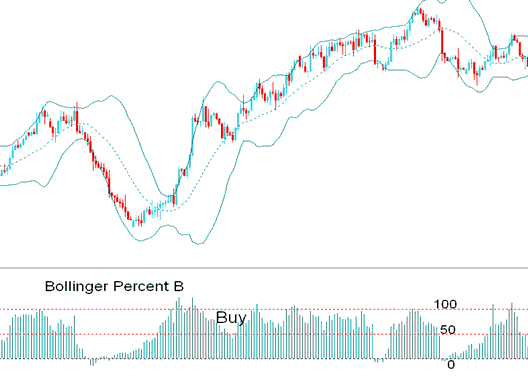
% b Bullish Buy Signal
Sell Trade Signal
Oscillator Indicator values/readings below 50 is a bearish.
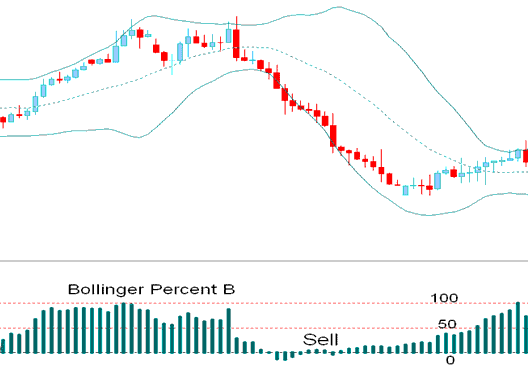
%b Sell Signal Indicating a Bearish Trade
Get More Courses and Tutorials:
- True Strength Index (TSI) MetaTrader 4 Indicator
- Forex Pivot Points Analysis
- EURJPY System EURJPY Trade Strategy
- SMI Course Lesson Index SMI Indices Strategy Guide
- How Do I Draw Downward Trade Channel on MT5 Online?
- Gold Platforms for iPad
- US 100 Index Strategy Lesson Tutorial Download
- Types of XAUUSD Systems and Types of XAUUSD Styles
- How Do You Start a Real Forex Best Forex Account?
- How to Choose and Select a Good Forex Trading Broker