What's Difference Between Bar Oil Trading Charts & Candles Oil Trading Charts?
Difference Between Bar Oil Trading Charts & Candles Crude Oil Trading Charts in Oil Trading
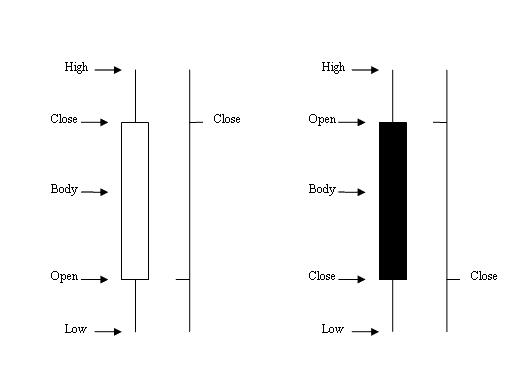
Bar Oil Trading Chartsare charts representation of the crude oil price on a oil chart displayed as sequence of OHCL bars. O H C L represents OPEN HIGH LOW & CLOSE. The Opening crude oil price is displayed as a horizontal dash on left and closing crude oil price as a horizontal dash on the right.
Candlesticks Oil Trading Charts - the candlesticks oil charts use the same crude oil price data as bar oil charts (open, high, low, and close). However, they in a much more easily identifiable way which resembles a candle with wicks on both ends.
Difference Between Bar Oil Trading Charts & Candles Crude Oil Trading Charts in Oil Trading


