What is a Candlesticks Oil Trading Chart in Oil Trading?
Types of Charts in Oil Trading
There are 3 types of charts used in Oil Trading: Line charts, bar crude oil charts and candlesticks oil trading charts.
Candlesticks Oil Trading Charts - the candlesticks oil charts use the same crude oil price data as bar oil charts (open, high, low, and close). However, they in a much more easily identifiable way which resembles a candle with wicks on both ends.
How to Read Candlestick Oil Trading Charts
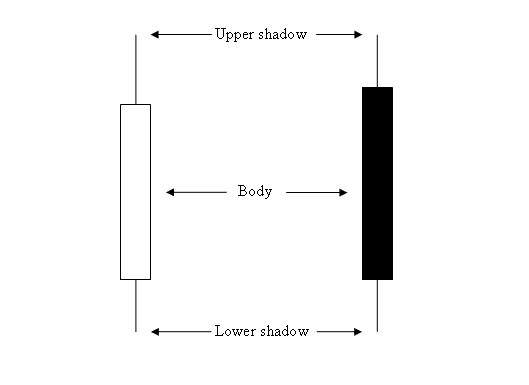
The rectangle part is called the body.
The high and low are described as shadows and drawn as poking lines.
What is a Candlesticks Oil Trading Chart in Oil Trading?
The color of the oil trading candlestick is either blue or red
- (Blue or Green Color candle) - Oil Trading Prices moved up
- (Red Color candlestick) - Oil Trading Prices moved down
Most trading platforms like the MT4 Oil Trading Platform , use colors to mark the direction. Colors used are blue or green: - green candle when crude oil price moves up, red candle when crude oil price moves down.


