What's Candle in Oil Trading?
A Oil Trading candlestick is a oil price representation which is used to represent the high, low, opening crude oil price & closing oil prices for a specific period of time. Oil trading candles looks like a candlestick with wicks on both ends thus their name - candlesticks.
This type of crude oil price representation is commonly used by oil traders because it is easier to trade with and interpret when analyzing crude oil price movement on the oil charts.
This candles pattern can be selected for trading on MT4 software & traders can then use this candlesticks oil charts when trading oil.
Candlesticks Oil Trading Charts - these candlesticks oil charts use the same crude oil price data as bar oil charts (open, high, low, and close). The oil candlesticks resembles a candle with wicks on both ends.
How to Analyze Candles Crude Oil Trading Charts
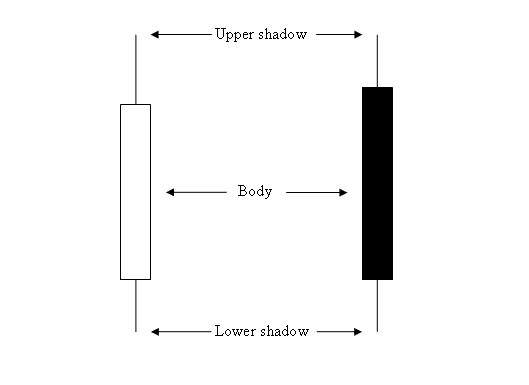
The rectangle part is called the body.
The high and low are described as shadows & drawn as poking lines.
How to Read Oil Charts Beginner Traders Guide
The color of the oil candlestick is either blue or red:
- (Blue or Green Color Candlesticks) - Oil Trading Prices moved up
- (Red Color Candles) - Oil Trading Prices moved down
Most oil trading platforms like the MT4 Crude Oil Trading Software, use colors to mark the direction of the oil price. Candles colors used are blue or green: when crude oil price moves upward, color of candle is blue: when crude oil price moves down, color of candle is red.
Drawing Candles Crude Oil Charts on MetaTrader 4 Software
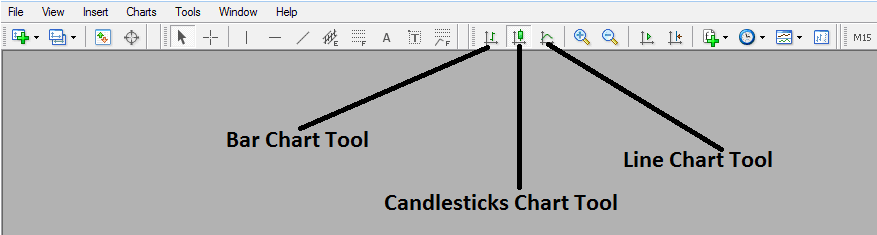
To draw these on the MT4 Crude Oil Trading Platform, select the charts plotting tools within the "MT4 Toolbar" - shown below.
Drawing Candles Oil Charts on MetaTrader 4 Software
To view this toolbar on MT4 platform go to 'View' Next to file at the top left corner of the MT4 Platform, Click 'View', Then Click 'Toolbars', Then check 'Charts' Button Key. Above MetaTrader 4 toolbar will appear.
Once the above charts tool bar, appears you can then select the type of oil chart you want to convert to, If you want to trade using the bar oil charts format, click the bar oil chart tool button as shown above, for line oil chart trading click the line oil charts tool button, for Japanese candlesticks oil charts click the "candlesticks oil charts tools button".


