What Happens in Crude Oil Trading after a Bull Flag Oil Trading Pattern?
The bull flag crude oil chart pattern is found within a Oil Trading upwards trend.
The bull flag crude oil pattern occurs at halfway point of a bullish upwards oil trend & after a break-out a similar move equivalent to the height of the flagpole is expected.
In this bull flag crude oil chart pattern is a continuation crude oil chart pattern where the crude oil market retraces slightly, it is therefore a slight retracement with narrow crude oil price action which has a slight downwards tilt.
The technical buy point is when crude oil price penetrates the upper line of the bull flag crude oil chart pattern. The flag portion has highs & lows which can be connected by small lines which are parallel, and it looks like a small channel.
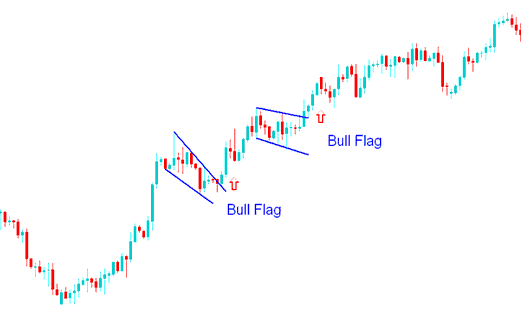
How to Analyze Bull Flag Oil Trading Chart Pattern
The bull flag crude oil pattern above was just a resting period as the crude oil market gathered strength to break out and move higher. Bull flag crude oil chart pattern oil trading continuation oil signal was confirmed as a upper line of this flag pattern was broken to the upside.


