Pivot Points Breakout Indicator
Oil Trading Pivot Support and Resistance Indicator Levels is a set of indicators used to determine potential turning points or potential oil breakout points, also known as " oil pivots" or oil pivot point. These Oil Trading Pivot Support and Resistance Levels are calculated to determine points which the oil trend could change from a "bullish" to "bearish trend or from a "bearish" to "bullish market trend." Oil traders use these Oil Trading Pivot Support & Resistance Levels as zones of support & resistance.
These Oil Trading Pivot Support & Resistance Levels are calculated as the average of the high, low & close from the previous session:
Oil Trading Pivot Point = (High + Low + Close) / 3
Day oil traders use the calculated oil pivot support and resistance levels to determine levels of entry, stop loss level and profit taking level, by trying to determine where the majority of oil traders might be doing the same thing.
A oil pivot point is a oil price level of significant oil technical analysis that is used by oil traders as a predictive or leading indicator of crude oil price movement. Oil Trading Pivot Support and Resistance Indicator is calculated as an average of significant oil prices (high, low and close oil price) from the crude oil market prior trading period. If the oil prices in the following trading period trade above the central oil pivot point it is interpreted as a bullish oil trend, whereas if crude oil price trade below the central oil pivot point is interpreted as bearish.
The central oil pivot point is used to calculate additional levels of support and resistance, below and above central oil pivot point - by either subtracting or adding crude oil price differentials calculated from previous day trading ranges.
A oil pivot point and the oil pivot support and resistance levels are often turning points for the direction of oil price movement.
- In an upward oil trend, the oil pivot point indicator and the oil pivot resistance levels - represent a ceiling level for the crude oil price - if crude oil price goes above this level the upward oil trend is no longer sustainable and a oil trend reversal is likely to happen.
- In a downwards oil trend, the oil pivot point and the oil pivot support levels may represent a low for crude oil price level or a resistance to further crude oil price decline.
The central crude oil trading pivot point can then be used to calculate the resistance and support zones as follows:
Oil Trading Pivot Support and Resistance Indicator Levels consist of a central oil pivot point level surrounded by three support levels below it and three resistance levels above it. Oil Trading Pivot Support and Resistance Levels provide a quick method for crude oil traders to get a general idea of how the crude oil market will be moving during the course of the day by using a few simple calculations based on the previous crude oil price close - Previous Day Close Breakout Oil Trading Strategy & Market Open Oil Trading Strategies.
Oil Trading Pivot Support and Resistance Indicator Levels is considered as a leading oil technical indicator rather than a lagging indicator. All that is required to calculate the oil pivot support and resistance levels for the current day is the previous day high, low, and close oil prices. The 24-hour cycle oil pivot support and resistance levels in this indicator are calculated according to the following formulas:
The central crude oil trading pivot point can then be used to calculate the resistance and support zones as follows:
Resistance 3
Resistance 2
Resistance 1
Oil Trading Pivot Point
Support 1
Support 2
Support 3
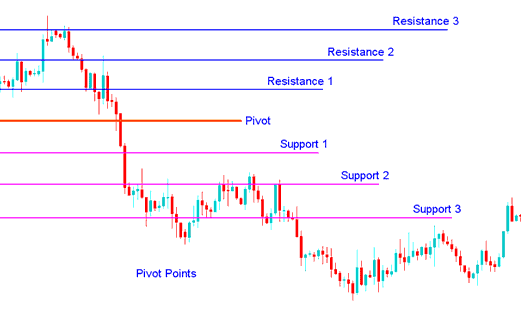
Pivot Points Breakout Crude Oil Indicator - Oil Pivot Support and Resistance Areas


