Moving Average Convergence/Divergence (MACD)
MACD Trading Strategy Guide
The MACD Oil Indicator was created by Gerald Appel.
The MACD Oil Trading Indicator is one of the simplest, most reliable, and most commonly used technical indicators available. The MACD is a momentum oscillator with some trend-following characteristics. MACD Technical Analysis in Oil Trading - The most popular oil technical analysis of the MACD indicator first calculates the difference between two moving averages and draws this as the MACD "Fast " line: and A second MACD "Signal " (trigger) line - the signal line is calculated from the resulting MACD "Fast " line and drawn in the same frame as the "Fast " line. The "standard " MACD values for the MACD indicator "Fast " line are a 12-period exponential moving average and a 26-period exponential moving average and a 9-period exponential moving average for the MACD indicator "Signal " line.
MACD Trading Strategy PDF - Understanding MACD Technical Indicator
The MACD indicator is widely used as a oil trend following indicator & tends to work most effectively when measuring wide-swinging market crude oil market price movements. There are three basic techniques for using the MACD indicator to generate trade signals.
MACD Oil Trading Crossovers:
1. MACD Fast line and MACD Signal line Crossover: A buy oil signal occurs when the MACD Fast line crosses above the MACD Signal line and a sell crude oil signal occurs when MACD Fast line crosses below the MACD Signal line.
2. MACD Fast line / Zero Line Crossover: When the MACD Fast line crosses above zero line a buy oil signal is given. Alternatively, when the MACD Fast line crosses below zero line a sell oil trade signal is given.
MACD Divergence: MACD Divergence Strategy
Looking for oil divergence between the MACD indicator & crude oil price can prove to be very effective in spotting potential oil trend reversal signals and/or oil trend continuation signals when it comes to crude oil price movement. There are several types of MACD divergence oil trading setups:
MACD Classic Divergence (Regular Divergence)
- MACD Bullish Divergence - Lower lows in crude oil price & higher lows in MACD indicator
- MACD Bearish Divergence - Higher highs in crude oil price and lower highs in MACD technical indicator
MACD Hidden Divergence
- MACD Bullish Divergence - Lower lows in MACD and higher lows in oil price
- MACD Bearish Divergence - Higher highs in MACD indicator & lower highs in oil price
MACD Technical Analysis in Oil Trading
The MACD indicator can be used to identify potential overbought and oversold levels in crude oil price movements. These overbought & oversold levels are generated by comparing the distance between the shorter moving average & the longer moving average used to calculate the MACD: if the shorter moving average separates dramatically from the longer moving average it may be a signal that crude oil price is over extending and it will soon return to more realistic levels.
Implementation of MACD settings
The crude oil price period, and Moving Average type for each of the moving averages (including the MACD Signal line) have been parameterized to allow a trader full customization of the MACD indicator setting. The MACD Oil Trading Indicator Fast line is drawn as a solid blue line. The MACD Oil Technical Indicator Signal Line is drawn as a solid red-line. A green Histogram drawn on the MACD indicator represents the difference between the MACD Fast-line and the MACD Signal Line is also included to make identifying their MACD indicator cross over points easier.
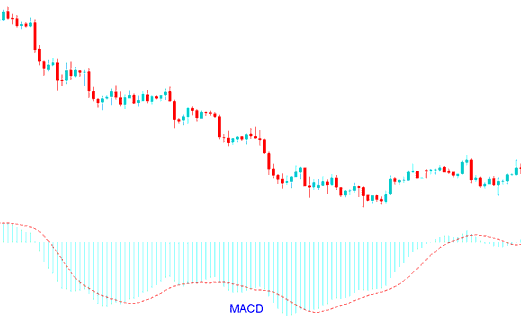
MACD


