Is Reverse Head and Shoulders Crude Oil Trading Pattern Bullish or Bearish?
Example of Inverse Head and Shoulders Oil Trading Chart Pattern
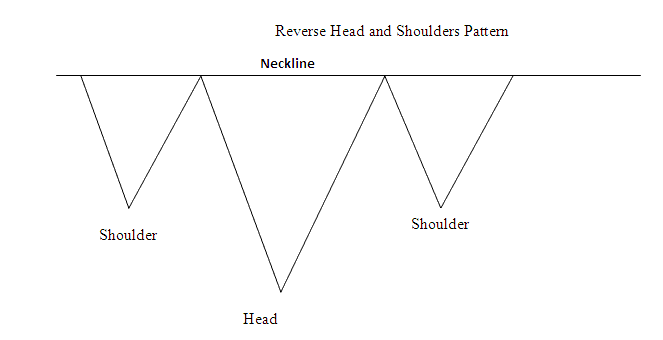
Reverse Head and Shoulders Oil Trading Chart Pattern is a Bullish Crude Oil Trading Chart Pattern - Reverse Head and Shoulders Pattern is a Bullish Oil Trading Signal Pattern
Summary:
- Inverse Head and Shoulders Oil Chart Pattern forms after an extended move downward
- Inverse Head and Shoulders Oil Trading Chart Pattern indicates that there will be a reversal in the crude oil market
- Inverse Head and Shoulders Oil Trading Chart Pattern formation resembles upside down, thus its name Inverse Head & Shoulders Oil Trading Chart Pattern.
- We buy when crude oil price breaks-out above neckline: as described on the crude oil trading example explained below.
What Happens To Oil Trading Price Action After a Reverse Head and Shoulders Oil Trading Chart Pattern?
Example of Inverse Head & Shoulders Oil Pattern on a Oil Trading Chart
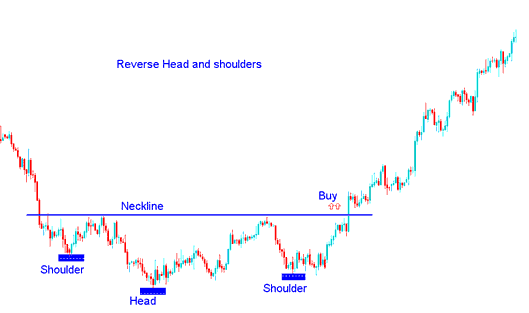
Example of Inverse Head & Shoulders Oil Trading Chart Pattern


