How to Trade Retracement on Downwards Crude Oil Trading Trend
How Do You Draw Oil Trading Fib Retracement for Oil Trading Downtrend?
The fibonacci retracement indicator is placed on a oil chart in an downward oil trending market and this Oil Trading Fibonacci Retracement indicator then calculates the retracement levels for the downward oil trend on the oil charts. Fibonacci retracement levels oil indicator is used by many oil traders as a oil trading retracement trading technical indicator.
In the Oil Trading Retracement Strategy example explained below the crude oil market is moving down between chart point 1 & chart point 2, then after chart point 2 the crude oil price then retraces up to 38.20% retracement level then it continues heading downward in the original downward oil trend. Note that this oil trading Fibonacci retracement indicator is plotted from point 1 to point 2 in the direction of the oil trend (Downward Direction).
Because we know this is just a retracement based on the chart oil trend we put a sell order at 38.2% Fibonacci retracement level and a stop loss just above 61.8% Fibonacci retracement level.
If you had put a sell order at the 38.2% Fibonacci retracement level as shown on the oil trade below you would have made a lot of pips afterwards after the crude oil price reached the 38.2% Fibonacci retracement level and then resumed the downward oil trend.
In this trade the retracement of crude oil price reached 38.20% Fibonacci retracement level & did not get to 50.0% Fibonacci retracement level. It is always good to use 38.20% Fibo retracement level because most times the crude oil price retracement does not always get to 50.0% Fibonacci retracement level.
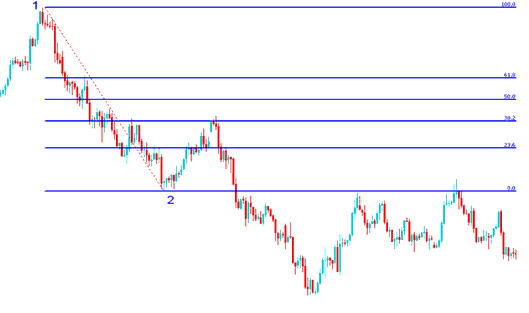
How to Trade Oil Price Retracement on Downwards Oil Trend - Oil Trading Fib Retracement Levels on Oil Trading Chart
Explanation for the Above Oil Trading Fib Retracement Strategy Examples
The above Oil Trading Fibonacci Retracement Strategy example is a oil retracement trading setup where the crude oil price retraces immediately after touching the 38.2% Crude Oil Trading Chart Fibonacci Retracement Level.
This Oil Trading Fibonacci Retracement level provided a lot of resistance for the crude oil price retracement, this was the best place for a trader to place a sell limit oil order as the crude oil market quickly moved down after hitting this 38.2% Fibonacci retracement level.


