Analyze Support and Resistance using Oil Trading Pivot Points
How to Interpret Support and Resistance using Oil Trading Pivot Points Strategy
Traders wanting to trade using oil support and resistance levels can use Oil Pivot Points indicator which is used by oil technical traders to calculate Resistance Zones as well as Support Levels for the oil price.
Oil Trading Pivot points will calculate 3 Support Levels below the current crude oil price and 3 Resistance Levels above the current oil price.
Traders can use Oil Trading Pivot Points indicator to find where these Support and Resistance Levels are - and then use these Support and Resistance Levels to open their crude oil trades or close their crude oil trades depending on the oil signals generated by their trading system.
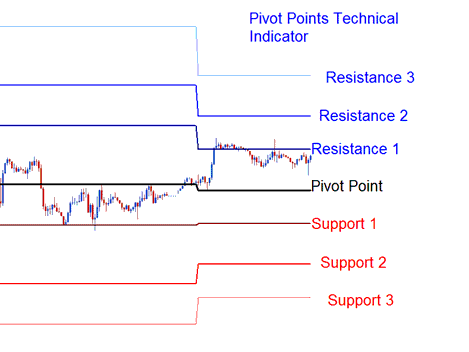
The pivot points oil trading technical indicator is made up of a center pivot-point that is surrounded by Three resistance levels above & 3 support levels below
Resistance Level 3
Resistance Level 2
Resistance Level 1
Pivot Point
Support Level 1
Support Level 2
Support Level 3
Oil Interpret Support & Resistance Zones using Oil Trading Pivot Points?
Support Levels using Oil Trading Pivot Points
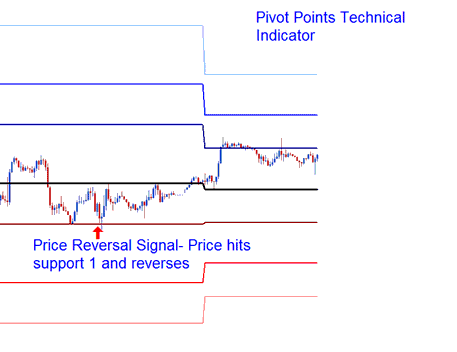
Support Levels in Oil Trading Pivot Points are used to generate buy oil trade signals
Buy oil signal - when crude oil price moves down towards one of the pivot support area, then touches the pivot support region or moves slightly beyond the pivot support region then it quickly reverses and starts moving upwards.
Resistance Levels using Crude Oil Trading Pivot Points
Resistance Levels in Oil Trading Pivot Points are used to generate sell oil trade signals
Sell oil signal - when crude oil price moves up toward one of the pivot point resistance level, then touches the pivot resistance region or moves slightly beyond the pivot resistance region then it quickly reverses and starts moving downwards.
Resistance Levels in Oil Trading Pivot Points are used to generate sell oil trade signals
Interpret Support & Resistance Zones using Oil Trading Pivot Points?


