Stock Indices Trading Moving Average System Explained
Stock Indices Trading 20 Pips Moving Average Stock Indices Systems
The 20 pips stock index price range moving average stock indices strategy is used with the 1 Hour stock indices chart and 15 minute chart. On this stock indices chart time frames we use the 100 and 200 simple moving average stock index technical technical indicator.
Both the 1 Hour and 15 minute chart time frames will use the 100 and 200 SMA (SMA Indicator) to determine the direction of the Stock Indices trend.
The 1 Hour stock indices chart time-frame checks the long term direction of the Stock Indices trend, upward or downward trend, depending on the direction of the moving averages. All stock index trades taken should be in this stock indices trend direction.
We then use the 15 minute chart to find the optimal point to enter stock index trades. Indices trades are opened only when the price is within 20 pips range of the 200 simple MA, if stock index price is not within this pip range stock index trades are not opened.
Stock Indices Trading Uptrend/Bullish Market
To generate buy (bullish stock indices signals) using the 20 pips moving average Stock Indices Trading strategy, we shall use the 1hour and 15 minute chart time frame.
On the 1 hour stock indices chart time frame the stock index price of the stock index chart should be above both the 100 and 200 simple moving average. We then move to a lower stock indices chart time frame, the 15 minute chart time frame to generate a stock indices trade signal.
On 15 minute chart time frame, when price reaches the 20 pips range above the 200 SMA, we open a buy stock indices trade and place a stop loss 30 pips below the 200 SMA. Stop loss can be adjusted to the amount of Pips that are suitable for your risk but to avoid being stopped out by normal Stock Indices Trading volatility its best to use 30 pips stop loss.
A buy stock indices trade can also be opened when the price touches the 100 Simple moving average, provided it’s not very far from the 200 SMA. Normally the 100 SMA will be within the 20 pips range of the 200 SMA.
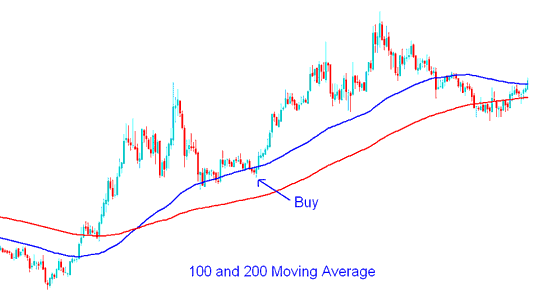
100 and 200 Simple Moving Average Stock Indices Buy Stock Indices Signal - Moving Average Stock Indices Strategy
Stock Indices Trading Downtrend/Bearish Market
To generate sell (short stock indices signals) using the 20 pips moving average Stock Indices Trading strategy, we shall also use the 1 hour stock indices chart time frame and 15 minute chart time frame.
On the 1 hour stock indices chart time frame, the stock index price should be below both the 100 and 200 SMA. We then move to the 15 minute chart time frame to generate a stock indices Signal.
On 15 minute chart, when price reaches the 20 pips range below the 200 SMA, we open a sell stock indices trade and place a stop loss 30 pips above the 200 simple moving average.
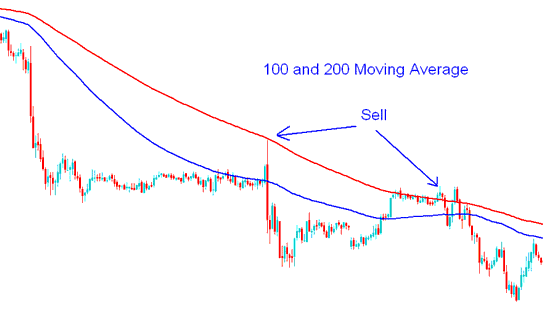
100 and 200 Simple Moving Average Stock Indices Sell Stock Indices Signal - Moving Average Stock Indices Strategy
With this stock indices strategy method stock index price will generally bounce of these support and resistance levels because many traders watch these levels, and open similar stock index trades at around the same point.
These support and resistance levels act as short term resistance or support levels within the stock index price charts.
Profit Taking level for This Stock Indices Strategy
With this stock indices strategy the stock index price will bounce & make a move in direction of the original Indices trend. This move will range from 60 - 70 pips.
The best stock indices profit-taking level would therefore be considered to be 60 to 70 pips from the 200 SMA.


