What Happens After Linear Regression Acceleration Bearish Crossover Forex Trading Signal?
Linear Regression Acceleration Bearish Crossover Signal is a signal that shows the price of a forex currency pair is closing lower than it opened. Once there is a bearish Linear Regression Acceleration crossover signal the prices of the currency pair are expected to keep move in a bearish downward trend - this means that the prices are expected to keep closing lower than where they opened.
The Linear Regression Acceleration bearish crossover signals - The average price of a currency pair will keep closing lower than it opened as long as the Linear Regression Acceleration bearish crossover signal remains bearish.
After Linear Regression Acceleration Bearish Crossover Signal - traders should open sell trades for that currency pair as this is a bearish trading signal.
If the Linear Regression Acceleration signals crosses above the Linear Regression Acceleration bearish crossover mark - then this shows that prices are no longer closing lower than where they opened and the bearish momentum has reduced and forex traders should close their open sell forex trades if they had opened forex trades based on this Linear Regression Acceleration Bearish Crossover Signal.
Linear Regression Acceleration Bearish Crossover Forex Trading Signal Explained
Linear Regression Acceleration FX Indicator Sell Forex Signal
How to Generate Forex Sell Signal Using Linear Regression Acceleration Technical Indicator
Steps on how to generate forex sell signals using Linear Regression Acceleration indicator:
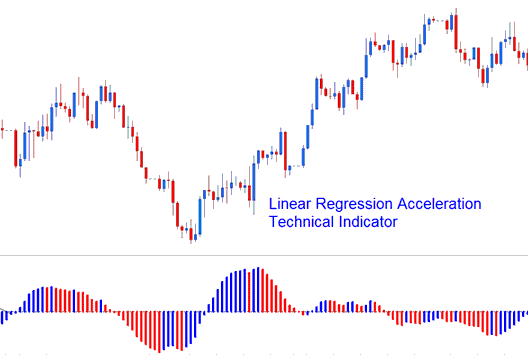
This Linear Regression Acceleration indicator sell signal tutorial explains how to generate forex sell signals using the Linear Regression Acceleration indicator as shown below:
How to Generate Forex Sell Signals Using Linear Regression Acceleration Indicator
Linear Regression Acceleration FX Trading Indicator Technical Analysis
Linear Regression Acceleration calculates the change in the regression line's gradient on the current price bar from its gradient from the previous price bar. The value used to calculate the linear regression is referred to as the normalized acceleration value which is plotted for each price bar formed on the price chart.
Linear Regression Acceleration
If the normalized acceleration is 0.30, then regression line normalized slope will be rising at rate of 0.30 per price bar.
Similarly, a normalized slope of -0.40 would indicate that the regression line normalized slope is declining at the rate of -0.40 per price bar.
For example, if the current price bar normalized slope value is 0.40 and the previous price bar normalized slope value is 0.20, then the normalized acceleration of the current price bar would be calculated as 0.40 - 0.20 = 0.20.
NB: It is important to realize that a positive acceleration value doesn’t equate to a positive slope value, it simply means the gradient of the slope is increasing. A negative acceleration value doesn’t equate to a negative slope value, it simply means the gradient of the slope is decreasing.
Implementation of Linear Acceleration Regression Indicator
The Linear Regression Acceleration indicator allows for the following; price selection, regression periods, smoothing of raw price before applying the regression and selection of the smoothing type.
Resulting regression slope is displayed as a bi-colored histogram that oscillates above and below 0.
The reference line is set at the 0 level mark.
- A rising slope: (greater than its previous value of 1 bar before) is displayed in the up slope color.
- A declining slope: (lower than its previous value of 1 bar before) is shown using the down slope color.


