Stochastic MetaTrader 4 Indicator
Developed by George C. Lane.
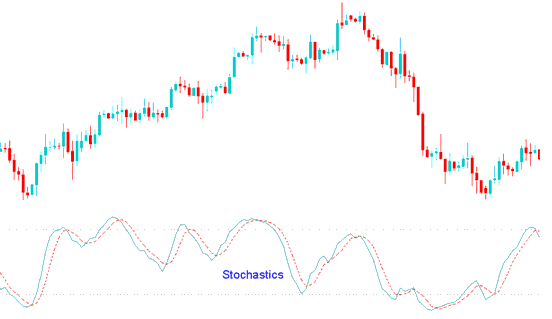
This is a momentum indicator designed to show the relation of the current close price relative to the high/low range over a given number of periods using a scale of 0-100. It is based on the assumption that in a rising market the price(s) will close near the high of the range and in a declining market the price(s) will close near the low of the range.
There are typically plotted as 2 lines: %K and %D. %K is the main (fast) line and %D is the signal (slow) line.
Explanation
There are three basic techniques for using the various Stochastic MetaTrader 4 Indicators to generate trading signals.
Stochastic MetaTrader 4 IndicatorCrossovers:
1. %K line / %D line Crossover: A buy signal occurs When the %K line crosses above %D line & a sell signal occurs when the %K line crosses below the %D line.
2. %K line / 50-level Crossover: When the %K line crosses above 50 a buy signal is given. Alternatively, when the %K line crosses below 50 a sell signal is given.
Stochastic MetaTrader 4 IndicatorDivergence:
Looking for divergences between the MetaTrader 4 Indicator & price can prove to be very effective in spotting potential reversal points in price movement. Trade long on Classic Bullish Divergence: Lower lows in price and higher lows in the MetaTrader 4 Indicator; Trade short on Classic Bearish Divergence: Higher highs in price and lower highs in the Indicator.
Overbought Oversold Levels:
The Stochastic MetaTrader 4 Indicator can be used to identify potential overbought and over-sold conditions in price movements. An Overbought level is generally described as the indicator being greater than or equal to the 80% level while an oversold level is generally described as the level being less than or equal to the 20% level. Trades can be generated when the stochastic crosses these levels. A buy signal occurs when the levels declines below 20% and then rise above that level. A sell signal occurs when the levels rise above 80% and then decline below that level.
Stochastic MetaTrader 4 Technical Indicator


