What's Ichimoku Kinko Hyo Indicator Forex Buy Signal & Sell Signal?
Ichimoku Kinko Hyo Forex Indicator Buy Trading Signal
How to Generate Forex Buy Signal Using Ichimoku Kinko Hyo Indicator
Steps on how to generate forex buy signals using Ichimoku Kinko Hyo indicator:
This Ichimoku Kinko Hyo indicator buy signal tutorial explains how to generate forex buy signals using the Ichimoku Kinko Hyo indicator as shown below:
How to Generate Forex Buy Signals Using Ichimoku Kinko Hyo Technical Indicator
Ichimoku Kinko Hyo Forex Indicator Sell Trading Signal
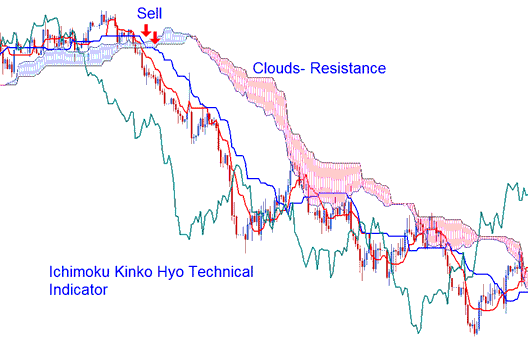
How to Generate Forex Sell Signal Using Ichimoku Kinko Hyo Technical Indicator
Steps on how to generate forex sell signals using Ichimoku Kinko Hyo indicator:
This Ichimoku Kinko Hyo indicator sell signal tutorial explains how to generate forex sell signals using the Ichimoku Kinko Hyo indicator as shown below:
How to Generate Forex Sell Signals Using Ichimoku Kinko Hyo Technical Indicator
FX Technical Analysis & How to Generate Signals
Bullish signal - Tenkan-Sen crosses Kijun-Sen from below.
Bearish signal - Tenkan-Sen crosses Kijun-Sen from above.
However, there are different levels of strength for the buy & sell signals generated.
What is Ichimoku Kinko Hyo Indicator Forex Buy Signal & Sell Signal?
Bullish crossover trading signal forms above the Kumo (clouds),
Very strong buy signal.
Bearish cross-over trading signal forms below the Kumo (clouds),
Very strong sell signal.
If a bullish/ bearish cross-over trading signal takes place within the Kumo (clouds) it is considered a medium strength buy or sell trading signal.
A bullish cross-over that occurs below the clouds is considered a weak buy signal while a bearish crossover that occurs above the clouds is considered a weak sell signal.


