How to Add Stochastic Oscillator Indicator on MetaTrader 4 Charts - Adding MT4 Stochastic Oscillator
Step 1: Open Navigator Window Panel on Forex Trading Platform
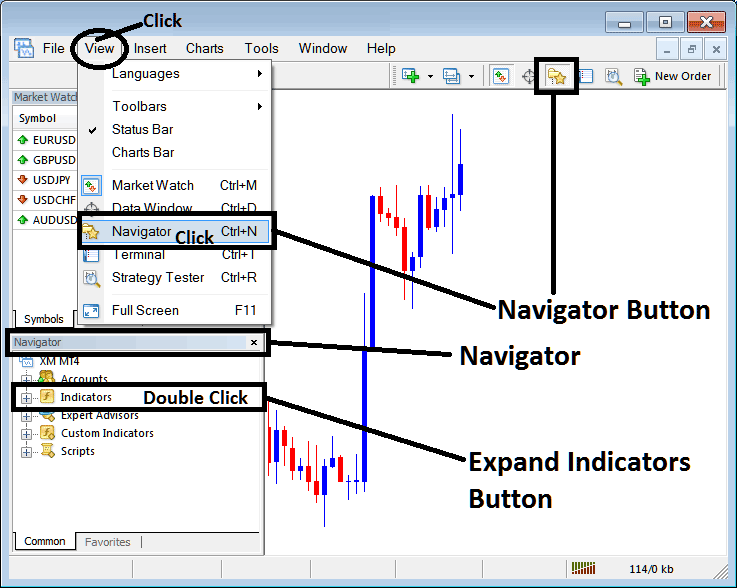
Open Navigator window as shown & illustrated below: Go to "View" menu (click on it), then select "Navigator" window (click), or From Standard Tool Bar click the "Navigator" button or press keyboard short cut keys "Ctrl+N"
On Navigator window, select 'Technical Indicators', (DoubleClick)
How to Add Stochastic Oscillator Indicator on MetaTrader 4 - MT4 Stochastic Oscillator Technical Indicator
Step 2: Expand the Indicators Menu on the Navigator - Adding Stochastic Oscillator MT4
Expand the menu by clicking the expand button marker (+) or double click the "indicators" menu, after this the button will appear as (-) and will now display a list as shown below - select the Stochastic Oscillator forex chart indicator from this list of forex indicators so as to add the Stochastic Oscillator indicator on the forex chart.
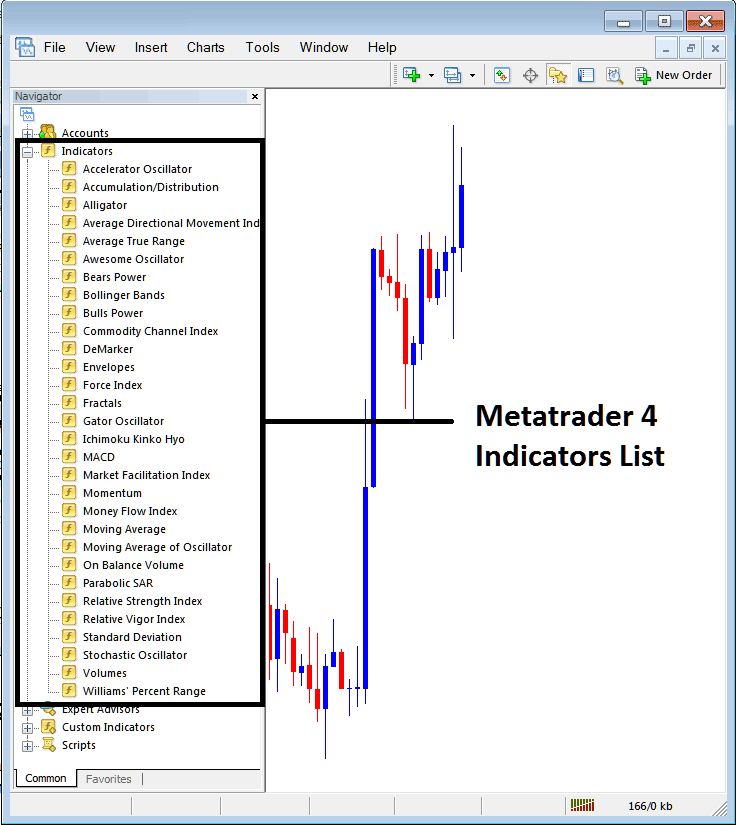
How to Add Stochastic Oscillator Indicator - From the Above window you can then place Stochastic Oscillator indicator that you want on the Forex chart
How to Add Custom Stochastic Oscillator Indicator to MT4
If the technical indicator you want to add is a custom indicator - for example if the Stochastic Oscillator technical indicator you want to add is a custom indicator you will need to first add this custom Stochastic Oscillator indicator on the MetaTrader 4 platform & then compile custom Stochastic Oscillator indicator so that the newly added Stochastic Oscillator custom indicator pops up on the list of custom indicators in MetaTrader 4 software.
To learn how to install Stochastic Oscillator indicators on MT4, how to add Stochastic Oscillator indicator window to MT4 and how to add Stochastic Oscillator custom indicator in MT4 - How to add a custom Stochastic Oscillator indicator in MetaTrader 4.
About Stochastic Oscillator Technical Indicator Described
Stochastic Oscillator Technical Analysis and Stochastic Oscillator Signals
Developed by George C. Lane
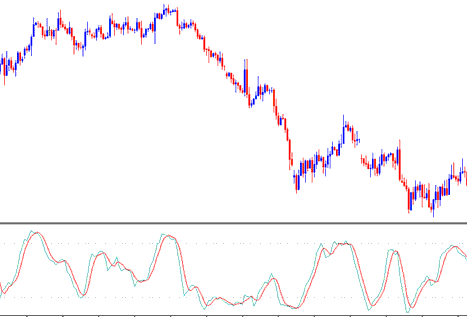
The Stochastic Oscillator is a momentum indicator - it shows the relation between the current closing price relative to the high and low range over a given number of n periods. The Oscillator uses a scale of 0-100 to plot its values.
This Oscillator is based on the theory that in an uptrend market the price closes near the high of the price range & in a downward trending market the price will close near the low of the price range.
The Stochastic Lines are drawn as 2 lines - % K and %D.
- Fast line %K is the main
- Slow line %D is the signal
3 Types of Stochastics Forex Trading Oscillators: Fast, Slow & Full Stochastics
There are Three types are: fast, slow and full Stochastic. Three indicators look at a given chart period for examples the 14-day period, and measures how the price of today’s close compares to the high/low range of the time period that's being used to calculate the stochastic.
This oscillator works on the principle that:
- In an uptrend, price tends to close at the high of the candlestick.
- In a downtrend, price tends to close at the low of the candlestick.
This indicator shows the momentum of the Forex trends, and identifies the times when a market is overbought or oversold.
FX Technical Analysis & Generating Signals
Most common techniques used for analysis of Stochastic Oscillators to generate Forex trading signals are cross overs trading signals, divergence signals & overbought over-sold levels. Following are the techniques used for generating signals
FX Crossover Signals
Buy signal - %K line crosses above %D line (both lines heading up)
Sell signal - %K line crosses below %D line (both lines heading down)
50-level Crossover:
Buy signal - when stochastic lines cross above 50 a buy signal is generated.
Sell signal - when stochastic lines cross below 50 a sell trading signal is generated.
FX Divergence Forex Trading
Stochastic is also used to look for divergences between this indicator & the price.
This is used to determine potential Forex trend reversal signals.
Upward/rising trend reversal - identified by a classic bearish divergence
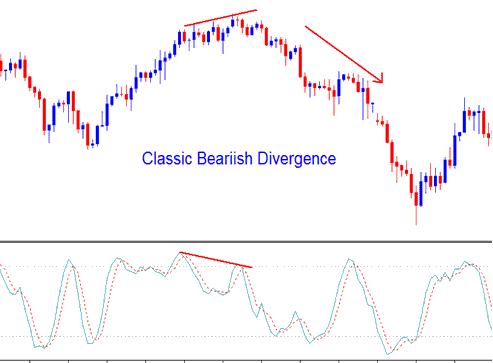
Trend reversal - identified by a classic bearish divergence
Downwards/descending trend reversal - identified by a classic bullish divergence
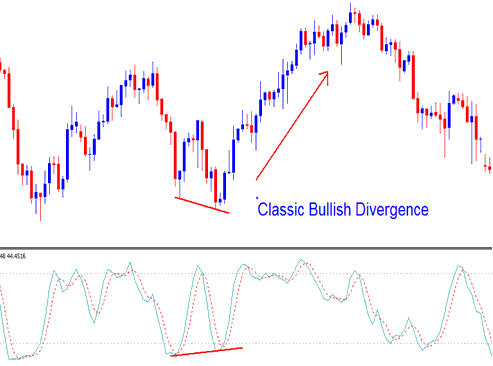
Trend reversal - identified by a classic bullish divergence
Overbought/Oversold Levels on Technical Indicator
Stochastic is mainly used to identify potential overbought & over-sold conditions in price movements.
- Over-bought values greater than 70 level - A sell signal occurs when the oscillator rises above 70% & then falls below this level.
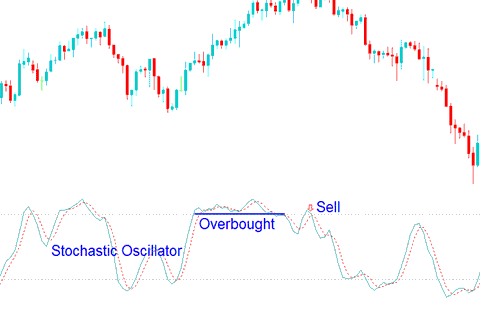
Overbought - Values Greater 70
- Over-sold values less than 30 level - a buy trading signal is generated when the oscillator goes below 30% and then rises above this level.
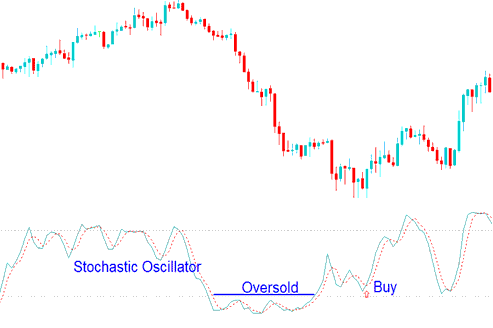
Oversold - Values Less Than 30
Trades are generated when the Stochastic Oscillator crosses these levels. However, overbought/oversold levels are prone to whipsaws especially when the forex market is trending upward or downward.


