How to Add Rainbow Indicator on MetaTrader 4 Charts - Adding MT4 Rainbow Forex Chart Indicator
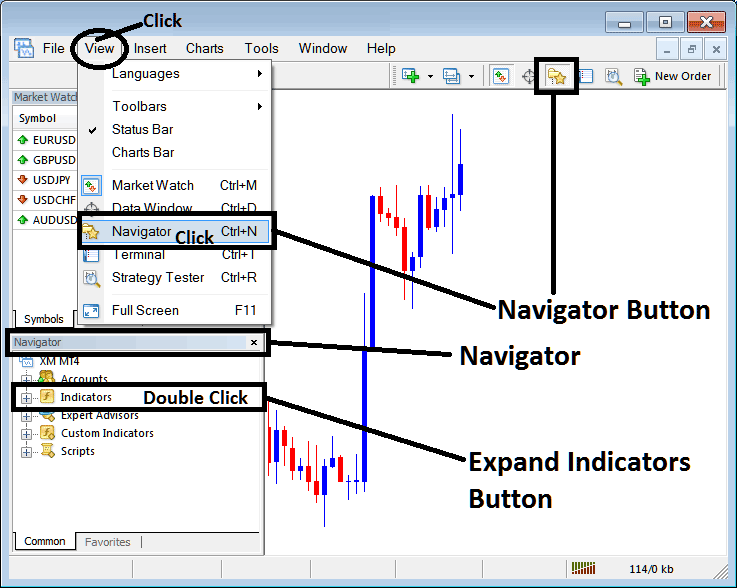
Step 1: Open Navigator Window Panel on Forex Trading Platform
Open Navigator window as shown & illustrated below: Go to "View" menu (click on it), then select "Navigator" window (click), or From Standard Tool Bar click the "Navigator" button or press keyboard short cut keys "Ctrl+N"
On Navigator window, select 'Technical Indicators', (DoubleClick)
How to Add Rainbow Indicator on MetaTrader 4 - MT4 Rainbow Technical Indicator
Step 2: Expand the Indicators Menu on the Navigator - Adding Rainbow MT4 Chart Indicator
Expand the menu by clicking the expand button marker (+) or double click the "indicators" menu, after this the button will appear as (-) and will now display a list as shown below - select the Rainbow forex chart indicator from this list of forex indicators so as to add the Rainbow forex indicator on the forex chart.
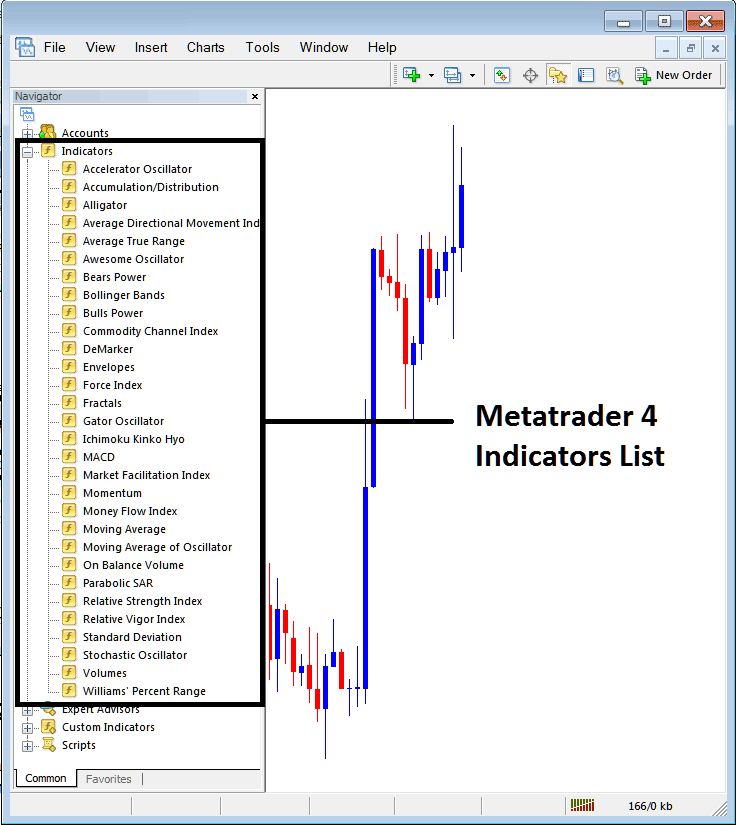
How to Add Rainbow Indicator - From the Above window you can then place Rainbow indicator that you want on the Forex chart
How to Add Custom Rainbow Indicator to MT4
If the technical indicator you want to add is a custom indicator - for example if the Rainbow technical indicator you want to add is a custom indicator you will need to first add this custom Rainbow indicator on the MetaTrader 4 platform & then compile custom Rainbow indicator so that the newly added Rainbow custom indicator pops up on the list of custom indicators in MetaTrader 4 software.
To learn how to install Rainbow indicators on MT4, how to add Rainbow indicator window to MT4 and how to add Rainbow custom indicator in MT4 - How to add a custom Rainbow forex indicator in MetaTrader 4.
About Rainbow Technical Indicator Described
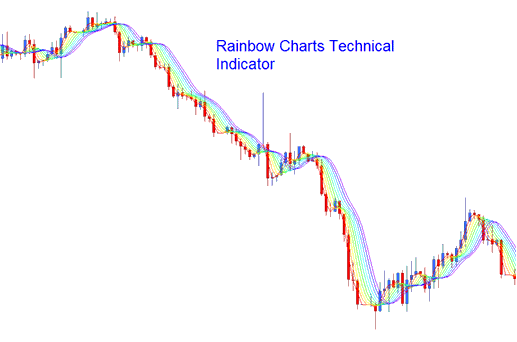
Rainbow Charts Technical Analysis & Rainbow Charts Signals
Developed by Mel Widner
This is a trend following indicator, similar to the moving averages - it is plotted using a 2 period simple moving average. The moving average is then smoothed to create a total of ten moving averages. The first moving average is the basis, then the next moving average is calculated using the first one, the third is then calculated using the second one and so on. This forms a rainbow shape of the currency trend, each moving average is applied with a different colors so as to look as a rainbow.
Forex Technical Analysis & How to Generate Signals
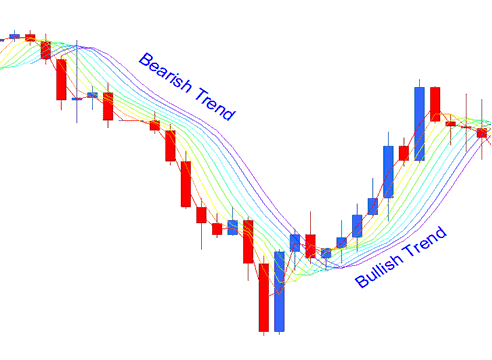
Bullish Forex Trading Trend/ Upwards FX Trading Trend
When the trend in the forex market is Upward/bullish trend, then the rainbow will be moving upwards, the least smoothed line will be at the top of the indicator, this is the red line and the major smoothed line will be at the bottom of the indicator, this is the violet line.
Bearish Market/Downward Forex Trading Trend
When the Forex trend is a bearish downward then the rainbow charts will be heading downward, the major smoothed line (Violet) will be at the bottom and the least smoothed line (Red) will be at the top.
FX Trend Continuation Forex Signal
As the trend continues in one direction up or down, the rainbow charts follow the price closely. The more the price moves away from the rainbow chart the more the trend is likely to continue, this is considered as a trend continuation signal. The indicator lines will also continue to expand its width; this is also another trend continuation signal.
FX Trend Reversal Forex Signal
When price starts moving towards the rainbow charts then this is seen as a trend reversal signal. The width of the indicator lines also contracts signifying a trend reversal signal. The reversal Signal is confirmed when the price penetrates through all the rainbow charts and the direction of the rainbow charts also reverses in their respective direction.


