How Do I Trade Forex Price with Different Chart Time frames? - Different Chart Time Frames Trading
Price Charting on Different Chart Time Frames - Example of Different Forex Chart Timeframes
Forex traders using technical analysis use forex charts to try and attempt to predict the movement of forex price on the forex trading charts.
Traders will sometimes use 2 or more forex chart time frames so as to determine the long term forex trend & short term forex trend.
How to Define A Forex Price Trend
Using a forex trading system that has Three indicators - Moving Average Crossover System, RSI & MACD & using simple rules to define the forex trend. The trading rules are:
Upwards Forex Trend
Both MAs Moving Up
RSI above 50
MACD Above Centerline
Downwards Forex Trading Trend
Both MAs Moving Down
RSI below 50
MACD Below Centerline
The forex traders using different chart time frames will need to testout various forex chart timeframes so as to determine the best chart timeframe for them to trade.
Multiple charts time frames analysis equals using 2 chart time-frames to trade Forex currencies - a shorter one used for trading & a longer one to check Forex trend.
Since it is always good to follow the market trend, in Multiple Time-frame Analysis, the longer time-frame gives us the direction of the long-term trend.
5 Min Forex Chart Timeframe
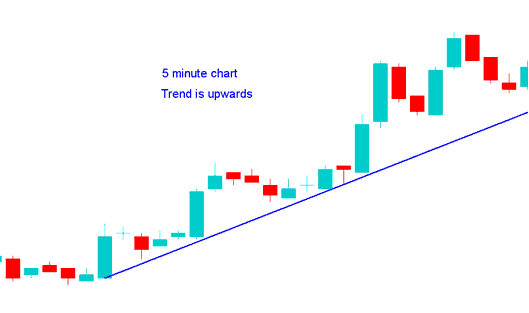
5 Min Forex Chart Time Frame - How Do You Trade Forex Price with Different Chart Time frames? - Trading on Multiple Charts
1 Hour Forex Chart Timeframe
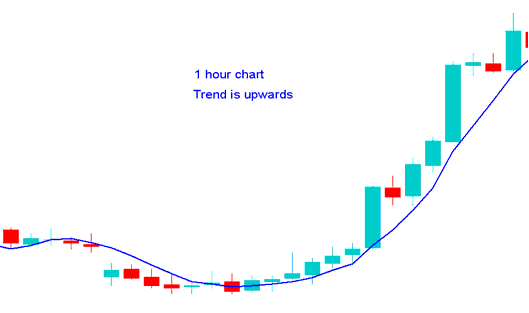
1 Hour Forex Chart Time Frame - How Do You Trade Forex with Different Chart Time frames?
4 H Forex Chart Timeframe
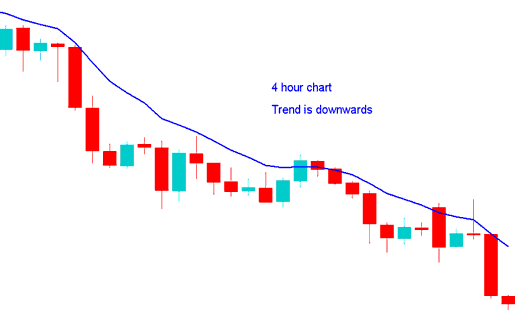
4 H Forex Chart Time-frame - How Do You Trade Forex Price with Different Chart Time-frames?
Weekly Forex Chart Timeframe
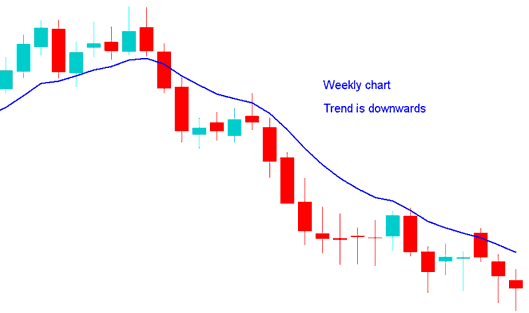
Weekly Forex Chart Time-frame - How Do You Trade Forex Price with Different Chart Time-frames?


