Divergence Trade Setups - RSI Indicator
Divergence is one of the trade transaction patterns used by the traders. Divergence trade setup involves looking at a chart & one more trading indicator. For our example we shall use RSI indicator.
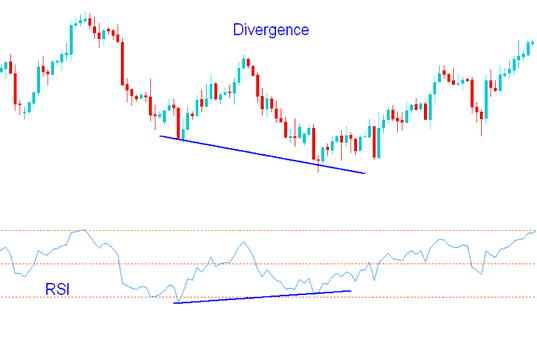
To spot this divergence trade setup find 2 chart points at which price makes and forms a new swing high or a new swing low but the RSI does not, indicating a divergence between price & momentum.
Example:
In the chart below we spot two chart points, point A and point B (swing highs)
Then using RSI we check and analyze highs made and formed by the indicator, these are highs that are directly below Chart points A and B.
We then draw one line on the chart & another line on the RSI technical indicator.

RSI Divergence Trade Setup
How to spot divergence setup
In order to spot this setup we look for the following:
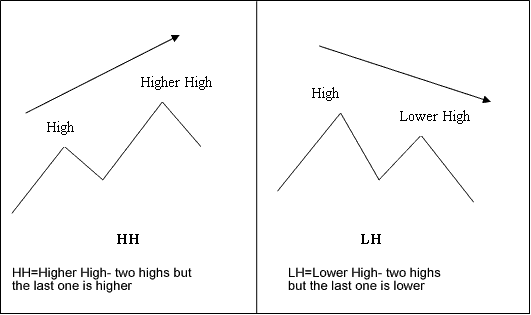
HH = Higher High - two highs but the last is higher
LH = Lower High : 2 highs but the last is lower
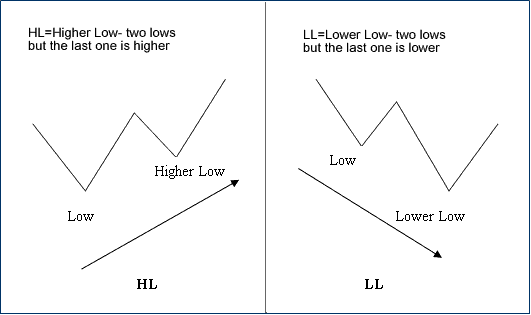
HL = Higher Low : 2 lows but last one is higher
LL = Lower Low : two lows but the last is lower
First let us look at the explanations of these trading terms

Divergence Trade Terms

Divergence Trade Terms
There are 2 types of divergence trade strategies:
- Classic divergence trade setup
- Hidden divergence trade setup
Get More Lessons:
- Placing Channels on XAUUSD Charts on MT4 Gold Charts
- What are Linear Regression Buy and Sell Signals?
- How Can I Trade MetaTrader 5 XAU USD Trendlines and MT5 XAU USD Channels on MT5 XAU USD Charts?
- How Can I Use Fractals Trading Indicator in Trading?
- How Much is 0.01 Lot in Trading?
- Chandes Trendscore MetaTrader 5 Analysis
- EUR AUD Trading Spreads
- EURSGD System EURSGD Trading Strategy
- How to Set GER 30 on MT4 PC
- List of Gold Review Broker Review


