Analysis of LWMA Indicator
FX Trend Identification
The Moving Average indicator can be used as an indicator for generating signals. A buy or sell signal is generated when the price either moves above or below the LWMA moving average, respectively.
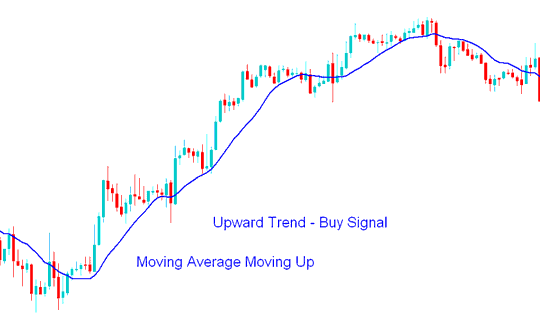
If the LWMA is moving upwards in diagonal manner then general trend is up-ward.
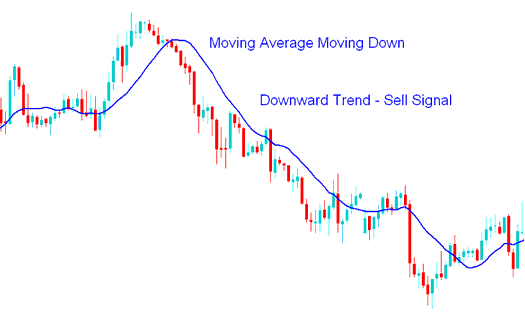
If the on the other hand the LWMA is moving downward in diagonal manner then general trend is downwards.
LWMA Upward Trend - LWMA Bullish Trend
If the LWMA is moving up, then the market trend is upward and the signal generated is a buy signal.
As long as the price is above the Moving Average indicator - then the trend will remain as an upwards trend. The MA will act as a 'support level' & forex price action should not close below the LWMA Indicator.
Buy Signal
When the price moves above the LWMA & closes above the moving average indicator - a buy signal is generated.
Forex Traders, who want to confirm the trading signal before trading, should wait until the LWMA line turns & starts to move in an upwards trend direction. It is always best to wait for confirmation signal to reduce odds of a whipsaw fakeout.

Best LWMA for 1H Chart, 1 Minute Chart and 15 Min Chart
Downwards Trend - Bearish Trend
If the LWMA is moving down, then the trend is downwards and the signal generated is a sell signal.
As long as the price is below the LWMA then the trend will remain as downward trend. The LWMA will act as a "resistance level" and price action should not close above the LWMA.
Sell Signal
When the price moves below the LWMA & closes below the moving average - a sell signal is generated.
Forex traders who want to confirm the signal should wait until the LWMA line turns and starts to move in a downwards direction. This will minimize the chance of trading a fake out.

Best LWMA for 4 Hour Chart - Best LWMA for Daily Chart
Range signals
Range signals can also be identified using the LWMA Indicator.
LWMA Crossover Method Strategy
The LWMA MA cross over strategy also is another signal generation strategy which is popular among traders in-comparison to the above signal generation strategy. Moving average cross over strategy also is the simplest form of a system vastly used by traders. This LWMA crossover strategy is combined with other indicators to form more complex strategies.
Best LWMA for 1 H Chart - Best LWMA for 1 Min Chart - Best LWMA for 15 Min Chart


