20 Period Moving Average Strategy - 50 Period Moving Average Strategy - 100 Period Moving Average Strategy
A trader can choose a moving average to trade with based on the forex chart time frame that they use for trading; a trader might choose the moving average to trade 1 minute chart, 1 hour forex chart, 4 hour forex chart, day forex chart or even weekly forex chart.
A trader can also choose to average the closing forex price, opening forex price or median forex price - when choosing a forex moving average indicator.
Moving average forex indicator is oftenly used to measure strength of forex trends. Data of the moving average is precise & its output as a line can be customized to the preferences of a forex trader.
Using the moving average forex indicator is one of the basic forex strategies to generate buy & sell signals which are used to trade in direction of the trend, since the moving average indicator is a lagging indicator and a forex trend following indicator. The Moving average forex indicator as a lagging forex indicator means that moving average will tend to give late forex signals as opposed to leading forex indicators. However, the Moving average indicator as a lagging forex indicator gives more accurate forex trading signals and is less prone to forex whipsaws compared to forex leading indicators.
Forex traders choose the moving average period to use when trading with this moving average forex indicator depending on the type of forex trading method they use: short term, medium term and long term.
- Short term forex trading: 20 Period Moving Average Strategy
- Medium term forex trading: 50 Period Moving Average Strategy
- Long term forex trading: 100 Period Moving Average Strategy
The period of the forex moving average in can be measured in 1 minute chart, 1 hour forex chart, 4 hour forex chart, day forex chart or even weekly forex chart. For our forex trading strategy example we will use 1 hour forex chart period.
Short term moving averages are sensitive to forex price action and can identify forex trend signals faster than the long term moving averages. Shorter term moving averages are also more prone to forex trading whipsaws compared to long term moving averages.
Long term moving averages help to avoid forex whipsaws, but are slower in identifying new forex trends and forex reversals.
Because long term moving averages calculate the average using more forex price data points, the long term moving average does not reverse as fast as a short term moving average and it is slow to catch the changes or reversals in the forex trend. However the longer term forex moving average is better when the forex trend stays in force for a longer time.
The task of a trader is to find a moving average period which will spot forex trends as early as possible while at the same time avoiding fake out signals - forex whipsaws. As a trader you will need to first test different forex moving average periods before deciding which forex moving average period is best suited for your style method based on the results of the testing that you'll do using different moving averages.
Moving Average Period Strategy - Forex Moving Average Strategy
Moving average forex indicator is a trend following forex indicator that is used by traders for three things:
- Identifying the beginning of a new forex trend
- Measure the sustainability of the new forex trend
- Identify the end of a forex trend & signal a forex trend reversal
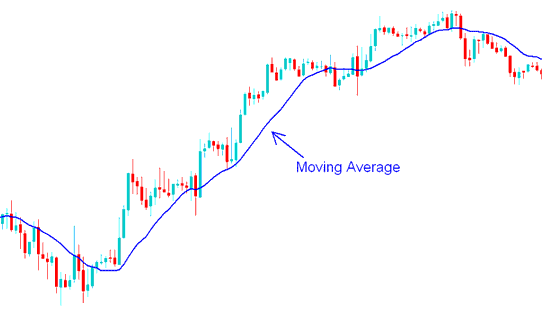
The moving average forex indicator is used to smooth out the volatility of forex price action. The moving average indicator is an overlay indicator and it is superimposed on the forex price chart.
On the moving average forex example below - the blue line represents a 20 period moving average, which acts to smooth out the volatility of the forex price action.
20 Period Moving Average Strategy - 50 Period Moving Average Strategy - 100 Period Moving Average Strategy
Calculation of the Moving Average Price Period
The moving average is calculated as an average of forex price using the most recent forex price data point - forex periods.
If a moving average uses the 20 period to calculate the moving average then it is referred to as a 20 period moving average, because most traders use the day forex chart as the standard price period we shall just refer to the moving average as the 20 day moving average.
To calculate the 20 day moving average the price of the last 20 days is averaged - and the average is then updated constantly after every new forex price period closes. So after every new forex price period close is formed the average is then re-calculated afresh using the most recent 20 price periods, that is why this forex indicator is called a moving average because the average is constantly moving when price data is updated and re-calculated.


