How Can You Tell a Bearish XAUUSD Trend?
Definition of a Downward XAUUSD Trend
How Can You Tell a Bearish XAUUSD Trend? - How Can You Define a Bearish XAUUSD Trend?
A bearish xauusd trend or a downwards xauusd trend is defined by gold trading prices closing with lower highs and lower lows. This is the definition of a bearish gold trend.
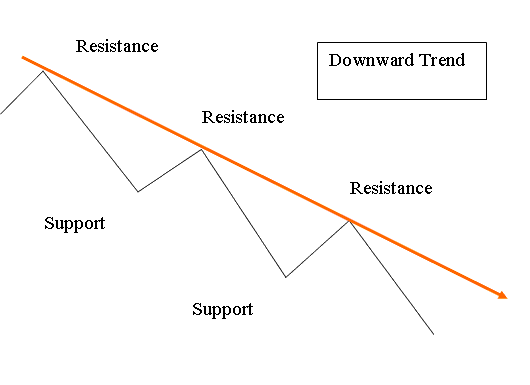
The example shown below defines the bearish xauusd trend setup
Simple Way to Identify XAUUSD Bearish XAUUSD Trend & Downward XAUUSD Trends
XAUUSD Trend is the xauusd market tendency of gold trading prices to move in a particular direction for a period of time
For a Downward xauusd trend the gold trading price will move in a general market direction downward.
This means gold prices will close lower than where they opened.
Trading Gold Identify XAUUSD Downward Trend
A downward xauusd trend-line is plotted above the downwards xauusd trend setup formed by consecutive lower highs, the downwards xauusd trend-line must connect at-least 2 highs, with the most recent high being lower. For our down xauusd trend examples we shall use the MetaTrader 4 technical analysis software charts to illustrate example of the downwards trend.
Since gold trading price moves downward in a zigzag manner xauusd traders normally draw a downward xauusd trend-line which shows the general downward xauusd trend direction. In xauusd trading analysis, this general direction is referred to as the TREND by traders. In technical analysis definition we can define this down xauusd trend-line is drawn on a XAUUSD chart showing the resistance areas (bearish market direction).
Definition of a Downward XAUUSD Trend - Explain How to Identify XAUUSD Down Trend Market Direction
A xauusd down trend bearish market xauusd trend occurs when the price forms a series of lower highs and lower lows. Each price high is lower than the previous high - lower high, & each low is lower than the previous low - lower low therefore showing bearish gold price trend movement.
Down xauusd trend xauusd trend lines gain more validity each time gold trading price touches the downwards xauusd trend line but doesn't penetrate the downwards xauusd trend line. A down trend bearish market remains the general trend direction until this sequence of lower highs and lower lows is broken - xauusd trend-line break.


