SMI Technical Analysis & SMI Signals
Developed by William Blau.
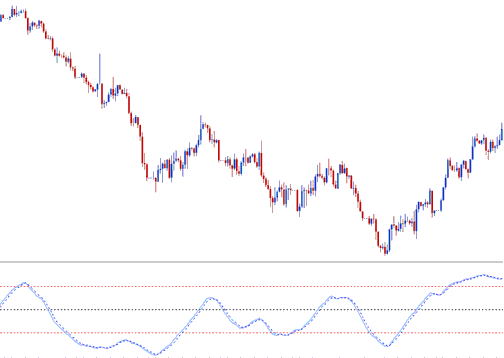
The SMI indicator is an adaptation of the classic Stochastic Oscillator Trading indicator which smoothes out the stochastic trading indicator oscillations.

Construction of SMI
This indicator measures price against the average of n periods.
Instead of showing these values directly, a smoothing method called Exponential Moving Average is used, and then the values are drawn to make the SMI.
When the closing price exceeds the average of the range, the SMI will ascend.
The SMI will exhibit a downward trajectory if the closing price falls below the computed average of the trading range.
This oscillator moves between +100 and -100. It avoids false signals better than the stochastic oscillator.
XAU/USD Technical Analysis and Generating Signals
Buy & Sell Trading Signals/ Cross over Signals
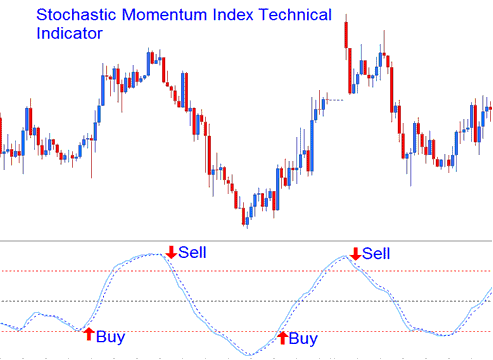
Use the SMI for buy and sell signals this way. Buy when it rises. Sell when it falls.

Buy & Sell Trading Signals/ Crossover Signals
Overbought/Oversold Level Trading Cross-overs
- Overbought levels above +40
- Over-sold levels below -40
A buy signal forms when the oscillator dips below oversold. Then it climbs back above and heads up.
Sell Signal is generated/derived when this oscillator rises above overbought level and then falls below this technical level & begins to move downward.
Divergence XAUUSD
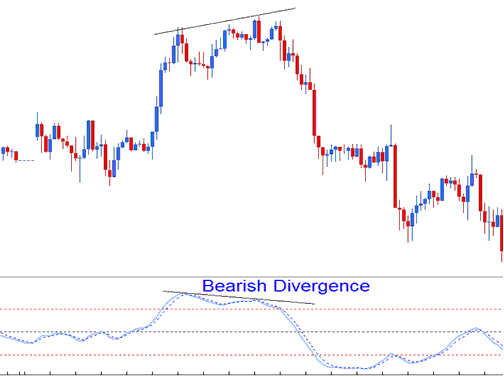
The chart below shows bearish divergence between price and SMI. After it, the trend flipped down.

Bearish Trade Divergence
Learn More Topics and Courses:

