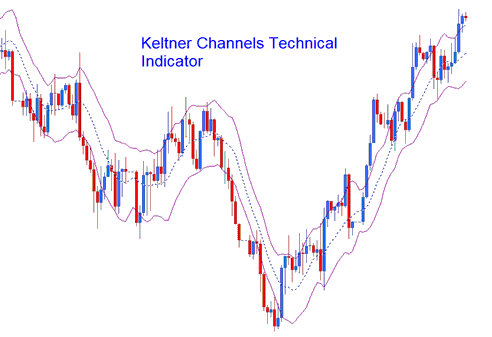
Keltner Bands Technical Analysis & Keltner Bands Signals
Created by Chester Keltner. Illustrated in his book 'How to Make Money in Commodities'
Keltner Channels are based on ATR technical indicator, the bands use ATR values to draw the band lines.
These Bands form Channels that help to spot the trends using this volatility channel.

Keltner Channels
Construction
Keltner Channels are like Bollinger Bands, but Bollinger Bands use a method called standard deviation to figure out how unstable the market is and draw the bands.
Keltner Bands utilize the Average True Range (ATR) measure of volatility instead of the standard deviation calculation.
This indicator calculates an exponential Moving Average over 'n' periods based on the closing price. These associated bands are constructed by
Adding (for the top line) and
Taking Away (for the bottom line)
An (n-period simple moving average of an n-period ATR) * an ATR multiplier.
Technical Analysis and How to Generate Trading Signals
This specific indicator shares operational similarities with Bollinger Bands for trading purposes.
Continuation Signals
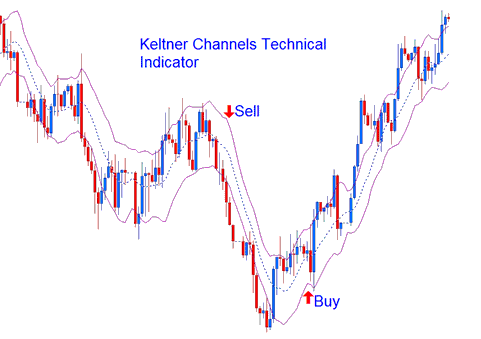
Price breaking outside the bands signals trend continuation. Buy when channels rise: sell when they fall.

Continuation Buy Sell Signals
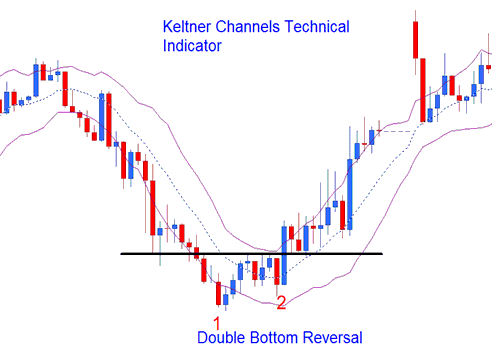
Reversal Signals - Double Tops and Double Bottoms
Tops and bottoms outside the bands, then inside Keltner channels, signal trend reversals.

Reversal Signals
Ranging Markets
In markets that stay in a range, a move that comes from one Keltner band usually will keep going until it gets to the other band.
Discover More Lessons, Tutorials, and Courses

