Read Continuation Chart Patterns
How to Analyze Continuation Chart Patterns
When continuation chart patterns are formed on the xauusd charts they confirm that the current trend direction is going to continue.
Continuation xauusd chart patterns are used by traders to determine the halfway point of the xauusd trend - this is because these continuation chart patterns form at the halfway point of a xauusd trend.
There are four different types of continuation trading patterns:
- Ascending triangle Continuation Chart Pattern
- Descending triangle Continuation Chart Pattern
- Bull flag Continuation Chart Pattern
- Bear flag Continuation Chart Pattern
Ascending Triangle Continuation Trading Pattern
The ascending triangle chart pattern is formed in an upwards xauusd trend - it shows that the upwards xauusd trend direction is going to continue.
Ascending triangle chart pattern forms as a consolidation period within the upward trend and signals upside xauusd trend continuation.
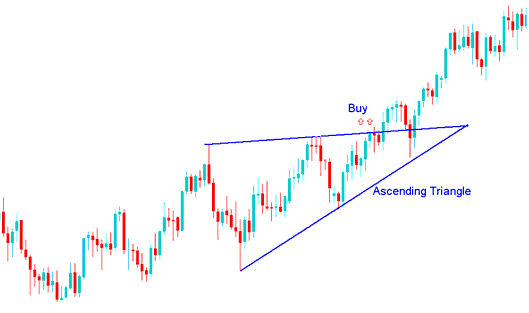
Interpret Ascending Triangle Chart Pattern
The gold price formed an ascending triangle pattern during its upward xauusd trend which led to upside continuation of the upwards trend.
The buy signal is generated when price moves above the upper sloping line of the ascending triangle chart pattern.
Descending Triangle Continuation Trading Pattern
The descending triangle chart pattern is formed in a downwards trend and it shows that the downward xauusd trend movement is going to continue.
The descending triangle chart pattern forms as a consolidation period within the downwards xauusd trend and signals downside continuation of the downward xauusd trend will follow.
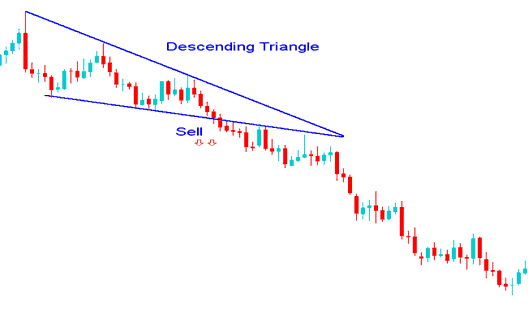
Interpret Descending Triangle Chart Pattern
The gold price formed a descending triangle chart pattern during its downwards xauusd trend which led to a continuation of the downward xauusd trend.
The sell signal is generated when price breaks out the lower horizontal sloping line of the descending triangle trading pattern.
Bull Flag Continuation Trading Pattern
Bull flag chart pattern forms what looks like a rectangle - formed by two parallel lines that act as support and resistance for the gold price until the gold price breaksout. In general, the bull flag chart pattern will not be perfectly flat but it will be sloping.
Bull flag chart pattern occurs at halfway point of an upward xauusd trend & after a gold price break-out a similar move equivalent to the height of the flagpole is expected.
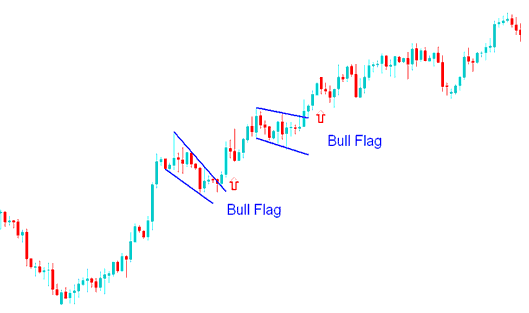
Interpret Bull Flag Chart Pattern - How to Analyze Continuation Chart Patterns
The Bull flag pattern shown above was just a resting period as the xauusd trend which then gathered momentum to break out and move higher.
The Bull flag pattern continuation xauusd signal was confirmed as upper line of the Bull flag pattern was broken to the upside.
Bear Flag Continuation Trading Pattern
Bear flag chart pattern flag is formed in a gold trading downwards trading trend.
The Bear flag chart pattern is a continuation chart pattern where the price retraces slightly with a narrow price action that has a slight tilt upwards.
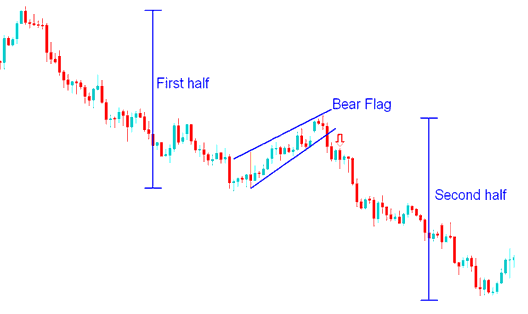
Interpret Bear Flag Chart Pattern - How to Analyze Continuation Chart Patterns
The Bear flag chart pattern shown above was just a resting period for the gold price prior to resuming the downwards xauusd trend.
The Bear flag chart pattern xauusd trading continuation trading signal was confirmed as the lower line of the Bear flag pattern was broken to the downside.
Read Continuation Chart Patterns


